A Multicentre Database for Normative Brainstem Auditory Evoked Potentials (BAEPs) in Children: Methodology for Data Collection and Evaluation
Authors Info & Affiliations
Abstract
Background:
The influence of physiological and methodological factors on recordings of brainstem auditory evoked potentials (BAEPs) is greater in children than in adults.
Objective:
To collect and evaluate BAEP data in normal children, and measure intra- and inter-laboratory variability.
Methods:
Seven hundred and fifty unselected BAEP recordings were collected and evaluated from children ranging from neonates to 14-year-olds by eight laboratories in Italy.
Results:
In newborns, three laboratories showed satisfactory concordance; wave I was more broadly distributed than wave V and IPL I-V. The evaluation of pooled BAEP data from the older children showed that laboratories with age-matched data gave overlapping results; those with unmatched-age data differed significantly. The sound intensities of the laboratories did not significantly affect absolute BAEP latencies or IPLs. Females had shorter latencies than males; the difference was not significant. A single exponential regression model was an adequate but not the best predictor of normal data.
Conclusions:
The pooled data were consistent with the physiological maturation of the brainstem acoustic pathway. The BAEPs was reliably normalised using the natural logarithm of age. The differences between Centres were related to sample size, measurement accuracy, and inclusion and selection criteria.
Significance:
The creation of multicentre common database from an unmatched data collection is feasible and reliable enough for clinical diagnosis and multicentre clinical research.
INTRODUCTION
In the perinatal period and early childhood, auditory brainstem evoked potentials (BAEPs) represent one of the most reliable means of evaluating the integrity of the cochlea and caudal neural brainstem pathway and, as our knowledge increases, they should continue to provide information concerning the neurological and audiological status of healthy and special risk populations [1]. However, BAEP recordings are affected to a greater extent in neonates and children than in adults by physiological factors (age is crucial) and methodological aspects (particularly stimulation procedures, recording settings, the selection of normal subjects and inclusion criteria), all of which need to be thoroughly evaluated in order to ensure the reliability of normative data and clinical interpretations.
Furthermore, the effect of age decreases over time, and is greatest in neonates and early infancy. Neonates mainly undergo auditory and electrophysiological evaluations in order to detection treatable hearing loss as early as possible and, together with other electrophysiological techniques, BAEP recordings in early infancy are used in the diagnosis of a wide range of pediatric neurological syndromes.
In order to be able to define normality accurately at a time when BAEPs are remarkably age-dependent, it is necessary to collect a considerable amount of raw data. As it would be practically impossible for any one clinical neurophysiology laboratory in Italy to cover the full range of ages from neonates to pre-adolescents, the main aim of this study was to investigate whether it would be possible to create a common normative database using pooled data from a number of independent laboratories by measuring their variability and reliability. The working hypothesis was that the discrepancies between the data submitted by each laboratory (which represent a part of the whole) and the pooled data (which represent the whole as if the data were collected by only one laboratory) would be those of any normative sample in which variability is only attributable to that of the sample itself: the presence of excessive variability would therefore suggest that laboratory methods were significantly influencing the measurements and the definition of normal.
It is hope that the critical evaluation of pooled data will lead to guideline recommendations concerning data collection and the creation of normative databases for pediatric BAEPs, so that laboratories can compare data and consequently improve the diagnostic reliability of electrophysiological testing. This study involved the collection of a large amount of raw data, and their intra- and inter-laboratory assessment, as we all as an evaluation of the methodological factors possibly responsible for any variability. The results should form the basis deciding common strategies and recommendations for recording and interpreting data, and designing studies of the clinical role of BAEPs in pediatrics.
MATERIALS AND METHODS
General Project Organisation
The creation of a multicentre normative database was promoted by the Italian Study Group on Pediatric Clinical Neurophysiology under the aegis of the Italian Society for Clinical Neurophysiology (SINC), and involved an annual informal meeting of laboratories working in pediatric neurophysiology to discuss methodological aspects and the clinical applications of evoked potentials (EPs). The objectives of the Study Group were to compare the methods used to acquire and analyse EPs, and collection normal recording data. Although a number of Centres had their own normative data, these did not cover the full age range of their clinical activities, or the sample sizes was small because of the difficulties of recruiting normal subjects.
Before beginning data collection, the Centres had to agree to certain minimum methodological requirements. They were asked to submit the data using a common replicated and protected electronic form in order to prevent any unintentional alterations, after which the data were inspected and any queries were returned to the Centres for verification. The original data sets were then merged and made available to all Centres for inspection, before any analysis was begun. Once the Centres gave their final approval, the data were analysed using a professional statistical package (Stata 8).
Centres and BAEP Data
The eight Centres participating in the study were the Neuropediatric Department of the University of Padua (PD) , the Neurophysiological Department of the National Institute of Neurology of Milan (MIBST), the Department of Clinical Neurophysiology of the University of Milan (MIMAN), the Neuropediatric Department of Bambino Gesù Hospital in Rome (RMBGS), the Neuropediatric Department of Rome’s La Sapienza University (RMLSP), the Neuropediatric Laboratory of the Mayer Pediatric Hospital in Florence (FI), the Neuropediatric Unit of the General Hospital of Novara (NO), and the Neonatology Department of the General Hospital of Udine (UD).
Of a total of 750 unselected data, 506 were evaluated and analysed: the exclusion criteria were prematurity (a gestational age (GA) of <37 weeks), neonates small for their gestational age, recordings obtained at sub-maximal intensity, and recordings requiring sedation as declared by the Centre. The subjects ranged from at-term neonates (GA >37 and <44 weeks) to children aged up to 5110 days (14 years). Tables1aand1b show the distribution of the BAEP data by Centre and age: the Centre with the smallest number was UD (=18 BAEPs) and the Centre with the largest number was MIBST (=149 BAEPs). The distribution of BAEP data by age (Table 1b) showed that one Centre (MIMAN) collected data from neonates only, and two other Centres (NO and UD) mainly from neonates and subjects in early infancy; although other Centres also provided neonate data, the figures were so low that the analysis was based on the data from these three Centres alone.
BAEP Data: Relative Frequency by Laboratory, and Cumulative Frequency
| Centre | Freq. | Percent | Cum. |
|---|---|---|---|
| FI | 77 | 15.22 | 15.22 |
| MIBST | 149 | 29.45 | 44.66 |
| MIMAN | 39 | 7.71 | 52.37 |
| NO | 86 | 17.00 | 69.37 |
| PD | 50 | 9.88 | 79.25 |
| RMBGS | 37 | 7.31 | 86.56 |
| RMSP | 50 | 9.88 | 96.44 |
| UD | 18 | 3.56 | 100.00 |
| Total | 506 | 100.00 |
BAEP Data Distribution by Age (Days) and Laboratory
| Centre | Mean | Median | SD | Min | Max |
|---|---|---|---|---|---|
| FI | 1940.92 | 1615.00 | 1573.93 | 25.00 | 5942.00 |
| MIBST | 2000.64 | 2205.00 | 1389.51 | 60.00 | 4505.00 |
| MIMAN | 1.18 | 1.00 | 0.76 | 0.00 | 3.00 |
| NO | 187.09 | 43.50 | 456.27 | 1.00 | 2847.00 |
| PD | 947.94 | 712.50 | 946.48 | 0.00 | 4530.00 |
| RMBGS | 2234.59 | 1460.00 | 1654.09 | 50.00 | 5110.00 |
| RMSP | 392.94 | 360.00 | 339.49 | 10.00 | 1080.00 |
| UD | 96.44 | 63.00 | 102.33 | 0.00 | 392.00 |
BAEPs: Median Age (Days), and Right (R) and Left (L) Mean Wave I, Wave V and IPL I-V Values
| Centre | Median Age (days) | R wave I | R wave V | R IPL I-V | L wave I | L wave V | L IPL I-V |
|---|---|---|---|---|---|---|---|
| FI | 1615.00 | 1.75 | 5.80 | 4.05 | 1.70 | 5.79 | 4.05 |
| MIBST | 2205.00 | 1.56 | 5.71 | 4.15 | 1.55 | 5.73 | 4.18 |
| MIMAN | 1.00 | 1.85 | 6.83 | 4.98 | 1.83 | 6.84 | 5.01 |
| NO | 43.50 | 1.85 | 6.50 | 4.65 | 1.75 | 6.51 | 4.76 |
| PD | 712.50 | 1.46 | 5.72 | 4.26 | 1.46 | 5.73 | 4.27 |
| RMBGS | 1460.00 | 1.58 | 5.73 | 4.15 | 1.54 | 5.69 | 4.15 |
| RMSP | 360.00 | 1.56 | 5.63 | 4.07 | 1.58 | 5.64 | 4.06 |
| UD | 63.00 | 1.85 | 6.75 | 4.90 | 1.91 | 6.78 | 4.87 |
BAEPs: Right (R) and Left (L) Mean Wave I, Wave III and IPL I-V Values by Age Grouping
| Age Group (days) | R wave I | R wave V | R IPL I-V | L wave I | L wave V | L IPL I-V |
|---|---|---|---|---|---|---|
| 0- | 1.86 | 6.81 | 4.95 | 1.83 | 6.84 | 5.00 |
| 31- | 1.77 | 6.44 | 4.67 | 1.75 | 6.50 | 4.75 |
| 61- | 1.61 | 6.05 | 4.44 | 1.55 | 6.01 | 4.46 |
| 120- | 1.73 | 6.17 | 4.44 | 1.61 | 6.14 | 4.53 |
| 240- | 1.57 | 5.70 | 4.13 | 1.56 | 5.68 | 4.10 |
| 1240- | 1.67 | 5.67 | 4.00 | 1.62 | 5.65 | 4.02 |
| 2240- | 1.56 | 5.65 | 4.09 | 1.53 | 5.66 | 4.13 |
| 3240- | 1.60 | 5.54 | 3.95 | 1.57 | 5.56 | 3.99 |
| 4240- | 1.60 | 5.63 | 4.03 | 1.57 | 5.61 | 4.04 |
Neonates: Mean Latencies and SD of Right and Left BAEPs
| R wave I | SD | R wave V | SD | L wave I | SD | L wave V | SD | |
|---|---|---|---|---|---|---|---|---|
| MIMAN | 1.85 | 0.19 | 6.83 | 0.36 | 1.83 | 0.17 | 6.84 | 0.32 |
| NO | 1.92 | 0.36 | 6.80 | 0.51 | 1.86 | 0.31 | 6.88 | 0.46 |
| UD | 1.83 | 0.21 | 6.82 | 0.60 | 1.89 | 0.20 | 6.87 | 0.63 |
| Total | 1.87 | 0.26 | 6.82 | 0.45 | 1.85 | 0.23 | 6.86 | 0.42 |
Neonates: Mean Latencies and SD of Right and Left BAEPs
| R IPL I-V | SD | L IPL I-V | SD | |
|---|---|---|---|---|
| MIMAN | 4.98 | 0.35 | 5.01 | 0.31 |
| NO | 4.87 | 0.41 | 5.02 | 0.39 |
| UD | 4.99 | 0.50 | 4.98 | 0.58 |
| Total | 4.95 | 0.40 | 5.01 | 0.38 |
Neonates: Summary of BAEP Data, Absolute Latency and IPL and Standard Deviation
| Right | side | Left | side | |
|---|---|---|---|---|
| Mean | SD | Mean | SD | |
| Wave I | 1.87 | 0.25 | 1.85 | 0.22 |
| Wave III | ||||
| Wave V | 6.81 | 0.45 | 6.84 | 0.42 |
| IPL I-III | ||||
| IPL III-V | ||||
| IPL I-V | 4.95 | 0.40 | 5.00 | 0.39 |
Early Infancy: Right (R) and (L) BAEP Data from Two Centres: Age Range 32-390 Days
| Centre | R wave I | L wave I | R wave V | L wave V | R IPL I-V | L IPL I-V |
|---|---|---|---|---|---|---|
| NO | 1.85 | 1.71 | 6.47 | 6.46 | 4.62 | 4.75 |
| UD | 1.82 | 1.84 | 6.49 | 6.52 | 4.67 | 4.68 |
| Total | 1.84 | 1.73 | 6.47 | 6.47 | 4.63 | 4.74 |
Infancy Age Data (Days)
| Centre | No. | Mean | Median | Min | Max |
|---|---|---|---|---|---|
| FI | 11 | 731.36 | 758.00 | 368.00 | 999.00 |
| MIBST | 37 | 639.86 | 620.00 | 300.00 | 1075.00 |
| PD | 30 | 681.17 | 635.00 | 425.00 | 1060.00 |
| RMSP | 28 | 649.29 | 650.00 | 360.00 | 1080.00 |
| Total | 106 | 663.54 | 642.50 | 300.00 | 1080.00 |
Infancy: Right (R) and Left (L) BAEP Mean Latencies and IPL
| Centre | R wave I | L wave I | R wave V | L wave V | R IPL I-V | L IPL I-V |
|---|---|---|---|---|---|---|
| FI | 1.70 | 1.66 | 5.65 | 5.62 | 3.95 | 3.95 |
| MIBST | 1.59 | 1.58 | 5.77 | 5.79 | 4.18 | 4.21 |
| PD | 1.46 | 1.46 | 5.72 | 5.75 | 4.26 | 4.28 |
| RMSP | 1.56 | 1.59 | 5.48 | 5.46 | 3.91 | 3.87 |
| Total | 1.56 | 1.56 | 5.66 | 5.67 | 4.11 | 4.11 |
Early Infancy: Right (R) and (L) BAEP Data from Two Centres: Age Range 32-390 Days
| Centre | No. | Mean | Median | Min | Max |
|---|---|---|---|---|---|
| FI | 52 | 2694.29 | 2103.5 | 1228 | 5942 |
| MIBST | 92 | 2947.28 | 2890 | 1105 | 4505 |
| PD | 12 | 2218.75 | 1792.5 | 1095 | 4530 |
| RMBG | 27 | 2947.04 | 2920 | 1095 | 5110 |
| Total | 183 | 2827.58 | 2615 | 1095 | 5942 |
Results in Childhood: Mean Latencies and SD of Right (R) and Left (L) BAEP Data
| Centre | R wave I | SD | L wave I | SD | R wave V | SD | L wave V | SD | R IPL I-V | SD | L IPL I-V | SD |
|---|---|---|---|---|---|---|---|---|---|---|---|---|
| FI | 1.73 | 0.18 | 1.67 | 0.14 | 5.65 | 0.23 | 5.62 | 0.20 | 3.92 | 0.20 | 3.95 | 0.19 |
| MIBST | 1.54 | 0.11 | 1.53 | 0.10 | 5.61 | 0.24 | 5.63 | 0.25 | 4.06 | 0.21 | 4.10 | 0.22 |
| PD | 1.45 | 0.04 | 1.46 | 0.04 | 5.61 | 0.14 | 5.62 | 0.15 | 4.16 | 0.15 | 4.16 | 0.16 |
| RMBG | 1.60 | 0.17 | 1.54 | 0.18 | 5.67 | 0.27 | 5.63 | 0.27 | 4.07 | 0.26 | 4.08 | 0.25 |
| Total | 1.60 | 0.16 | 1.57 | 0.14 | 5.63 | 0.24 | 5.63 | 0.23 | 4.03 | 0.22 | 4.06 | 0.23 |
BAEP Data Using the Logarithmic (NL), Quadratic (Qu) and Linear (Li)Regression Models, by Centre. Neonates NOT Included. Right and Left Wave I
| Centre | R wave I (NL) | R wave I (Qu) | R wave I (Li) | L wave I (NL) | L wave I (Qu) | L wave I (Li) |
|---|---|---|---|---|---|---|
| FI | 2.00 | 1.76 | 1.79 | 1.92 | 1.71 | 1.73 |
| 0.18 | 0.19 | 0.19 | 0.15 | 0.16 | 0.16 | |
| MIBST | 1.82 | 1.58 | 1.60 | 1.78 | 1.56 | 1.58 |
| 0.12 | 0.12 | 0.12 | 0.12 | 0.12 | 0.12 | |
| NO | 2.00 | 1.84 | 1.85 | 1.88 | 1.73 | 1.73 |
| 0.27 | 0.27 | 0.27 | 0.27 | 0.27 | 0.27 | |
| PD | 1.69 | 1.46 | 1.48 | 1.67 | 1.47 | 1.48 |
| 0.07 | 0.06 | 0.06 | 0.07 | 0.06 | 0.06 | |
| RMBGS | 1.83 | 1.60 | 1.62 | 1.77 | 1.56 | 1.58 |
| 0.20 | 0.19 | 0.19 | 0.19 | 0.19 | 0.19 | |
| RMSP | 1.75 | 1.55 | 1.56 | 1.75 | 1.58 | 1.58 |
| 0.11 | 0.10 | 0.10 | 0.13 | 0.12 | 0.12 | |
| Total | 1.85 | 1.64 | 1.65 | 1.80 | 1.60 | 1.62 |
| 0.20 | 0.20 | 0.20 | 0.18 | 0.18 | 0.18 |
Right and Left Wave V
| Centre | R wave V (NL) | R wave V (Qu) | R wave V (Li) | L wave V (NL) | L wave V (Qu) | L wave V (Li) |
|---|---|---|---|---|---|---|
| FI | 7.00 | 5.92 | 6.03 | 7.04 | 5.90 | 6.02 |
| 0.31 | 0.43 | 0.40 | 0.29 | 0.42 | 0.38 | |
| MIBST | 6.94 | 5.83 | 5.96 | 7.02 | 5.85 | 5.98 |
| 0.26 | 0.27 | 0.27 | 0.29 | 0.30 | 0.30 | |
| NO | 7.16 | 6.38 | 6.41 | 7.20 | 6.39 | 6.42 |
| 0.42 | 0.50 | 0.48 | 0.41 | 0.53 | 0.51 | |
| PD | 6.82 | 5.75 | 5.83 | 6.88 | 5.76 | 5.85 |
| 0.18 | 0.13 | 0.14 | 0.20 | 0.14 | 0.15 | |
| RMBGS | 6.97 | 5.88 | 6.00 | 6.99 | 5.85 | 5.97 |
| 0.28 | 0.32 | 0.31 | 0.27 | 0.31 | 0.30 | |
| RMSP | 6.52 | 5.58 | 5.62 | 6.58 | 5.60 | 5.65 |
| 0.26 | 0.30 | 0.29 | 0.28 | 0.31 | 0.30 | |
| Total | 6.92 | 5.89 | 5.99 | 6.98 | 5.90 | 6.00 |
| 0.34 | 0.41 | 0.39 | 0.34 | 0.42 | 0.40 |
Right and Left IPL I-V
| Centre | R IPL I-V (NL) | R IPL I-V (Qu) | R IPLI-V (Li) | L IPL I-V (NL) | L IPL I-V (Qu) | L IPL I-V (Li) |
|---|---|---|---|---|---|---|
| FI | 5.00 | 4.15 | 4.25 | 5.12 | 4.19 | 4.29 |
| 0.26 | 0.35 | 0.33 | 0.24 | 0.35 | 0.32 | |
| MIBST | 5.13 | 4.25 | 4.35 | 5.24 | 4.29 | 4.40 |
| 0.24 | 0.26 | 0.26 | 0.27 | 0.29 | 0.28 | |
| NO | 5.16 | 4.54 | 4.56 | 5.33 | 4.66 | 4.68 |
| 0.36 | 0.43 | 0.41 | 0.36 | 0.45 | 0.43 | |
| PD | 5.13 | 4.28 | 4.35 | 5.22 | 4.30 | 4.37 |
| 0.15 | 0.12 | 0.12 | 0.17 | 0.14 | 0.14 | |
| RMBGS | 5.14 | 4.28 | 4.38 | 5.22 | 4.29 | 4.39 |
| 0.28 | 0.32 | 0.31 | 0.28 | 0.31 | 0.30 | |
| RMSP | 4.77 | 4.02 | 4.06 | 4.83 | 4.02 | 4.06 |
| 0.22 | 0.26 | 0.25 | 0.27 | 0.32 | 0.30 | |
| Total | 5.07 | 4.25 | 4.33 | 5.18 | 4.30 | 4.38 |
| 0.28 | 0.33 | 0.32 | 0.30 | 0.36 | 0.35 |
Regression Based on NL Model of Age (Neonates Included)
| Variable | Coefficient | Predicted value |
|---|---|---|
| Right side | ||
| Wave I | 0.03997300 | 1.89 |
| Wave III | 0.12867281 | 4.72 |
| Wave V | 0.17822931 | 6.98 |
| IPL I-III | 0.08913009 | 2.84 |
| IPL I-V | 0.13834500 | 5.09 |
| Left side | ||
| Wave I | 0.03901546 | 1.85 |
| Wave III | 0.12663467 | 4.70 |
| Wave V | 0.18318683 | 7.01 |
| IPL I-III | 0.09099785 | 2.87 |
| IPL I-V | 0.14402376 | 5.16 |
Regression Based on Quadratic Model of Age (Neonates Included)
| Variable | Coefficient | Predicted value |
|---|---|---|
| Right side | ||
| Wave I | -0.00000001 | 1.68 |
| Wave III | -0.00000002 | 4.07 |
| Wave V | -0.00000003 | 6.09 |
| IPL I-III | -0.00000002 | 2.40 |
| IPL I-V | -0.00000003 | 4.41 |
| Left side | ||
| Wave I | -0.00000001 | 1.65 |
| Wave III | -0.00000002 | 4.05 |
| Wave V | -0.00000003 | 6.10 |
| IPL I-III | -0.00000002 | 2.42 |
| IPL I-V | -0.00000003 | 4.45 |
Right and Left BAEP Data (Mean and SD) by Logarithmic Regression Model of Age, by Centre and Total. Neonates Included in the Model
| Centre | R wave I | L wave I | R wave III | L wave III | R wave V | L wave V |
|---|---|---|---|---|---|---|
| FI | 2.03 | 1.97 | 4.82 | 4.78 | 7.05 | 7.06 |
| 0.18 | 0.15 | 0.25 | 0.23 | 0.31 | 0.29 | |
| MIBST | 1.85 | 1.83 | 4.71 | 4.71 | 6.99 | 7.04 |
| 0.12 | 0.13 | 0.18 | 0.19 | 0.26 | 0.29 | |
| MIMAN | 1.85 | 1.84 | 4.64 | 4.64 | 6.85 | 6.85 |
| 0.20 | 0.19 | 0.34 | 0.29 | 0.39 | 0.33 | |
| NO | 2.01 | 1.90 | 4.90 | 4.83 | 7.20 | 7.24 |
| 0.30 | 0.28 | 0.37 | 0.39 | 0.45 | 0.43 | |
| PD | 1.71 | 1.71 | 4.62 | 4.59 | 6.85 | 6.89 |
| 0.08 | 0.08 | 0.24 | 0.23 | 0.19 | 0.21 | |
| RMBGS | 1.87 | 1.82 | 4.72 | 4.67 | 7.01 | 7.01 |
| 0.20 | 0.19 | 0.26 | 0.24 | 0.28 | 0.27 | |
| RMSP | 1.77 | 1.79 | 4.50 | 4.48 | 6.59 | 6.62 |
| 0.11 | 0.13 | 0.27 | 0.25 | 0.32 | 0.32 | |
| UD | 2.00 | 2.07 | . | . | 7.37 | 7.38 |
| 0.18 | 0.19 | . | . | 0.23 | 0.29 | |
| Total | 1.89 | 1.85 | 4.72 | 4.70 | 6.98 | 7.01 |
| 0.21 | 0.19 | 0.29 | 0.28 | 0.36 | 0.36 |
Right and Left IPL I-V
| Centre | R IPL I-III | L IPL I-III | R IPL III-V | L IPL III-V | R IPL I-V | L IPL I-V |
|---|---|---|---|---|---|---|
| FI | 2.79 | 2.83 | 2.19 | 2.26 | 5.02 | 5.09 |
| 0.19 | 0.19 | 0.21 | 0.16 | 0.26 | 0.25 | |
| MIBST | 2.86 | 2.90 | 2.25 | 2.32 | 5.14 | 5.21 |
| 0.16 | 0.17 | 0.17 | 0.20 | 0.24 | 0.27 | |
| MIMAN | 2.78 | 2.80 | 2.21 | 2.23 | 5.00 | 5.01 |
| 0.30 | 0.29 | 0.22 | 0.21 | 0.38 | 0.32 | |
| NO | 2.89 | 2.96 | 2.27 | 2.39 | 5.19 | 5.33 |
| 0.30 | 0.36 | 0.34 | 0.33 | 0.39 | 0.37 | |
| PD | 2.90 | 2.90 | 2.21 | 2.29 | 5.14 | 5.19 |
| 0.22 | 0.21 | 0.17 | 0.18 | 0.15 | 0.17 | |
| RMBGS | 2.86 | 2.88 | 2.26 | 2.32 | 5.15 | 5.19 |
| 0.18 | 0.17 | 0.22 | 0.19 | 0.28 | 0.28 | |
| RMSP | 2.73 | 2.71 | 2.07 | 2.12 | 4.82 | 4.83 |
| 0.25 | 0.27 | 0.25 | 0.25 | 0.28 | 0.32 | |
| UD | . | . | . | . | 5.37 | 5.30 |
| . | . | . | . | 0.26 | 0.26 | |
| Total | 2.84 | 2.87 | 2.22 | 2.29 | 5.09 | 5.16 |
| 0.23 | 0.25 | 0.23 | 0.24 | 0.31 | 0.32 |
BAEP Recording Methods
As the data were not collected in accordance with pre-defined guidelines but had already been acquired, both the similarities and differences in methodology will be described here.
All of the Centres, obtained BAEPs by means of monoaural stimulation and broadband clicks generated by 100 microsecond electric pulses; the acoustic stimulus was administered through a headphone applied to the subject’s ear. In neonates and early infancy, the monoaural stimulation was applied while the subject was lying down and sleeping, and so no unmasked sound (white noise) was applied to the non-stimulated ear. The Centres recording BAEPs in neonates declared that the recordings were made differently from those made in early infancy or childhood; however, there were no major differences in the data collected by the three Centres including neonates in their study. As any data whose collection required sedation were excluded from the study, all of the early infancy data were collected under waking or light sleeping (stage 1) conditions.
The temporal rate was 10-11 Hz, and intensity 70-80 nHL, depending on the technical specifications of the instrument. An above-threshold (40 dBnHL) BAEP was also recorded in the neonates and subjects in early infancy in order to ensure that an intensity in the maximal range was guaranteed for all recordings. The BAEPs were recorded by means of a surface electrode placed over Cz, with the reference electrode positined over the inner side of the ear lobe. A one-channel recording setting was used in neonates; for the other subjects, two channels were used in four Centres, and a few laboratories used a third recording of Ai-Ac in order to obtain better wave I resolution.
The polarity of the sounds was rarefaction modality, although three Centres used alternating modality. The low band pass filter was 75-150 Hz , and the high band pass filter 3000 Hz. The post-acquisition traces were not digitally filtered. Between 1000 and 2000 averaged sweeps were used for each trace for each trace, and at least two traces were recorded in each subject. All of the laboratories used an automated artifact rejection system, but the levels varied from laboratory to laboratory. The results used for the database were obtained from the mean (grand average) of the measurements made on the two best traces. As the acceptance criteria did not include the visual evaluation of traces, any ambiguous data were sent back to the Centres for checking before being included in the analysis.
Not all of the laboratories evaluation all BAEP waves and IPLs, and so the parameters considered were the absolute latencies of waves I, III and V and interpeak latencies (IPL) I-III, III-V and I-V. The amplitudes of waves I and V were not included in the database and were therefore not analysed.
Statistical Analysis
The data were analysed using a professional statistical package (Stata version 8.0). The intra-laboratory data relating to the absolute latencies of waves I, III and V and their IPLs were analyzed by means of descriptive statistics (mean, median, standard deviation, standard error), histogram distributions, one- and two-way variance analysis (ANOVA) and Scheffé tabulation/comparison, and logistic regression. The paired t-test was used for the side-to-side symmetry evaluations, and the unpaired t-test to compare genders. The inter-laboratory analysis included a between-laboratory age-matched comparative evaluation, and a comparison of the age-corrected laboratory data.
The pooled data were analysed by means of logistic regression using linear, quadratic and logarithmic models, thus enabling us to determine the best model for predicting neonate values (which were chosen as the target because the data did not require any correction for age). At this stage of the analysis, the neonate data were not included in the model. The model that best predicted the neonate values was chosen for the final step of the subsequent analyses, which included a second regression analysis of all of the data (including the neonate data) in order to be able to calculate the coefficients (i.e. the constant [_b] of the model) for the subsequent step of correcting the original data for age. Finally, the age-corrected underwent analysis of variance.
RESULTS
The data (BAEP waves I, III and V and IPL) were highly heterogeneous among Centres(Table 2a), but sorting by age-group demonstrated their age dependency: the lower the age, the higher the absolute latency and IPL (Table 2b). Furthermore, the BAEP data from older subjects were less affected by age and less variable than those from neonates or the subjects in early infancy.
The neonate data were analysed first and separately because they were crucial for the model of pooled data.
Neonates
A total of 80 data sets from three Centres (MIMAN=39, NO=27 and UD=14) were evaluated. Tables 3a, 3band 3c show the individual Centre mean values and standard deviation of BAEP waves I and V, and IPL I-V, and Fig. (1) shows the histogram distribution, and the normal distribution and density curves. The concordance of the findings from the three laboratories was generally satisfactory: the mean values were centered in two Centres, and slightly higher in one. The variance was overlapping, the data were skewed to the right, and there were a few outliers in the NO Centre. The mean values and symmetry at MIMAN were closer to those of the pooled data than in UD or NO, both of which showed right-left asymmetry and mean values that were slightly different from each other and on the two sides. In addition, the standard deviation at NO was higher than at the two Centres. It is possible that sample size and measurement accuracy were responsible for the slight differences.
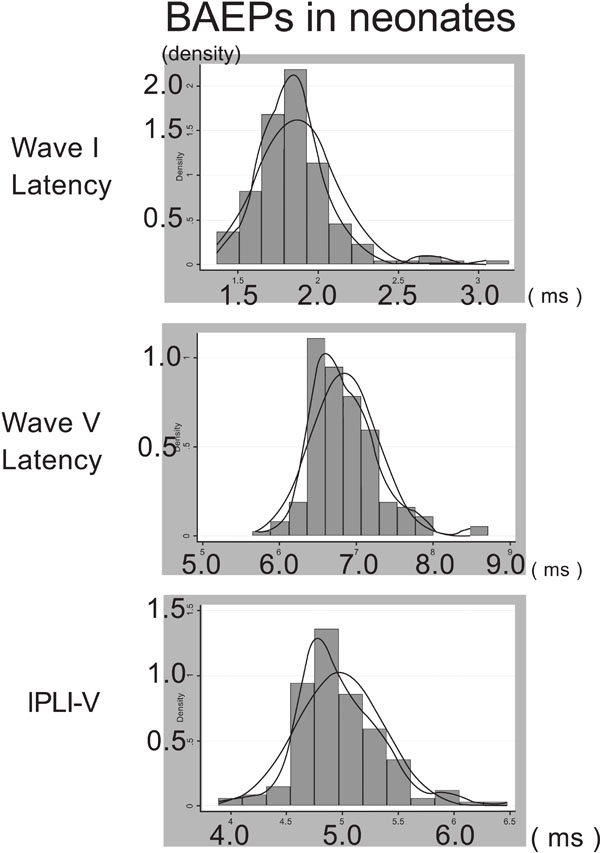
Merged right and left BAEPs in neonates. The panels show the histogram of distribution, normal distribution and density distribution of wave I (top), wave V (middle) and IPL I-V (bottom).
One-way ANOVA of the absolute latencies and IPL showed significant differences in relation to right and left wave I, left wave V, and left IPL I-V.
The paired student t-test for the symmetry of the individual Centre data the pooled data was not significant for wave I or V; there was a slightly significant difference in IPL I-V only for NO.
Early Infancy
The early infancy analysis based on a total of 63 age-matched data from two Centres: UD and NO. The subjects’ age ranged from 32 days to 392 days (mean values 99 and 138 days; median values 62 and 115 days). The mean absolute latencies and IPL I-V are shown in Table 4.
One-way ANOVA revealed significant between-Centre differences in right and left waves I and V and right IPL I-V (<0.03); the difference in left IPL I-V was not significant.
The side-to-side symmetry evaluation showed that wave I and IPL I-V significantly differed in NO, but the differences at UD were not significant.
Like in the neonates, the histogram distribution was asymmetrical due to skewing to the right, with some outliers (Fig. 2a).
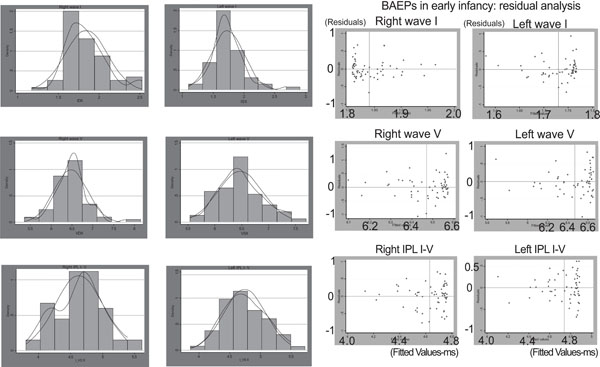
a. Right and left BAEPs in early infancy. The panels show the histogram of distribution, normal distribution and density distribution of wave I (top), wave V (middle) and IPL I-V (bottom).
b. BAEPs in early infancy: dot plots of the residuals of right and left wave I (top), right and left wave V (middle) and right and left IPL I-V (bottom).
Regression analysis indicated that age had a significant effect on the data, and that wave V was more affected than wave I. Comparison of the residual and fitted values showed that waves I and V were both asymmetrical with respect to the mean, but in opposite directions: wave I was shifted to the left and wave V to the right (Fig. 2b).
Infancy
The analysis was made using a total of 109 infancy data from four Centres (FI, MIBST, RMSP and PD). The subjects’ age ranged from 300 to 1080 days (mean 663 and median 642 days) (Table 5a). Table 5b shows the mean wave latencies and IPL. Symmetry analysis of the intra-Centre data revealed no significant differences: the total data overlapped until second decimal place; the histogram distribution showed that they were well centered on the mean but skewed to the right, and with a number of outliers. This affected wave I more than wave V and IPL (Fig. 3a). The residual evaluation showed that there was no pattern of distribution for wave I and wave V (Fig. 3b).
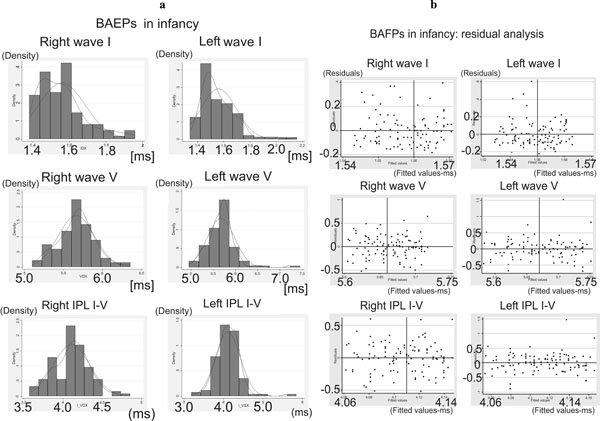
a. Right and left BAEPs in infancy. The panels show the histogram of distribution, normal distribution and density distribution of wave I (top), wave V (middle) and IPL I-V (bottom).
b. BAEPs in infancy: dot plots of the residuals of right and left wave I (top), right and left wave V (middle) and right and left IPL I-V (bottom).
One-way (data vs age) and two-way ANOVA (data vs age and Centre) indicated that age had a strong, Centre-independent effect on correlations and regression patterns, but the Centre effect was even stronger because of similarities and discordances between pairs of Centres: a) FI and RMSP were alike in that they had wave V and IPL I-V in the lower range, but wave I was in the higher range in FI; PD and MIBST both had wave V and IPL I-V in the higher range, but wave I was in the lower range in PD. The multiple comparison test, using either Scheffé’s or Bonferroni’s normalisation, indicated that wave I was most discordant in PD and wave V most discordant in RMSP; as far as IPL I-V was concerned, the Centres showed two-by-two similarity. RMSP was the most discordant in terms of both absolute latency and IPL.
Childhood
We analysed a total of 183 data relating to children aged more than 1081 days and coming from four Centres (FI, RMBGS, MIBST and PD). The age data are shown in Table6a, and the mean BAEP wave latencies and IPL inTable6b. The two-way paired t-test of symmetry showed a slightly significant difference in wave I in FI and RMBG, wave V in RMBGS, and IPL I-V in MIBST; analysis of the pooled data also revealed slightly significant differences in wave I and IPL I-V.
The histogram distribution analysis showed that the absolute latency of wave I was skewed to the right, with a number of outliers; however, wave V and IPL I-V both had a quite normal distribution, with some outliers.
One-way ANOVA (data vs age) did not reveal any statistically significant effect of age on latencies and IPL, but one-way ANOVA (data vs Centre) showed that Centre had a significant effect. Two-way ANOVA (data vs age and Centre) of absolute latencies and IPL I-V showed that right and left wave I were significantly different; this was due to the higher latency in FI, whereas there were no differences among the other three Centres; right and left wave V showed no statistically significant difference. Finally, right and left IPL I-V showed a statistically significant difference in relation to FI, but there were no differences among the others.
The multiple comparison test, using either Scheffe or Bonferroni normalization, indicated that FI and PD were the most discordant for wave I and IPL I-V but in opposite directions compared with the means of pooled data and the other two Centres. The Center FI was the most discordant both in the wave I absolute latency and IPL I-V. This might suggest a lurking variable for this specific Centre.
Effect of Gender
Only two Centres (FI and MIBST) provided data by gender. Females had slightly shorter absolute latencies and IPL I-V than males, but this difference was not significant (unpaired two-tailed t-test by Centre and using the pooled data).
Regression Model of Pooled Data
Three regression models were analysed: linear, quadratic and the natural logarithm (NL) of age. The logistic regression of the pooled data (excluding neonates) indicated that the correlation was high when the data were regressed using the NL of age (Figs. 4a and 4b), and this model was found to be the best for predicting the values in neonates alone. The results obtained with the three models (by Centre and using pooled data) for right and left wave I and V absolute latencies and IPL I-V are shown in Tables7a, 7band7c.The regression model showed that the predicted values were only slightly less than the real values obtained in neonates, thus indicating the robustness of the model.
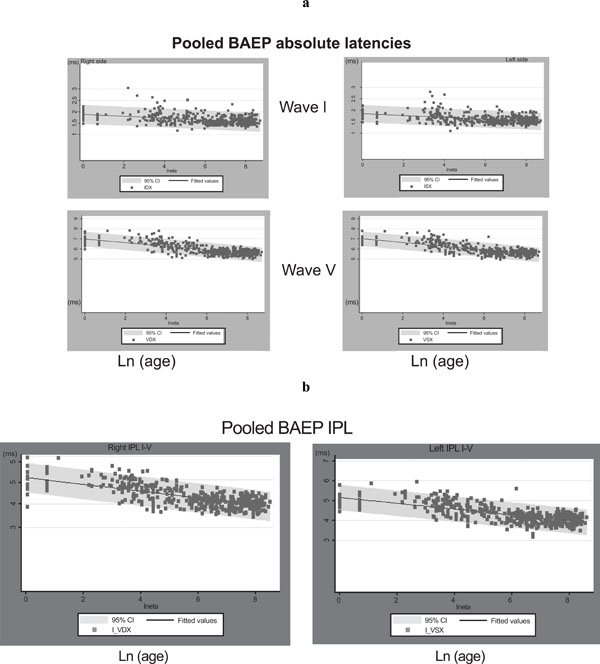
a. Pooled wave I and wave V data plotted against the natural logarithm of age; the regression curve is also shown.
b. Pooled IPL I-V data plotted against the natural logarithm of age; the regression curve is also shown.
Correction led to a pool of age-independent data, thus allowing them to be expressed more practically as mean values and standard deviation. The correction procedure entailed subtracting the age correction factor from each BAEP datum (latency and IPL) using the formula: [data – (coefficient*ln(age))]. The coefficients of each parameter (right and left wave I and V latency, and right and left IPL I-V) and the constants are shown in Table 8a – note that the constant is the same as the predicted value. For purposes of comparison, the coefficients and predicted value based on the quadratic model are shown in Table8b, and the neonate data are shown in Table3c. Tables9a and 9b show the individual Centre and total data corrected by age, including the neonates.
DISCUSSION
1. General Discussion
Our pooled data analysis showed a close relationship between BAEP wave latencies and IPL and age, but not gender, type of click or intensity in the maximal range. Logistic regression analysis demonstrated non-linearity: an exponen-tial relationship of latencies and IPL during the first year, with a critical point at about 150 days and a time constant of about 300 days for wave I. The data from subjects aged more than two years showed a highly significant linear correlation with age. Given the continuum of data with age (despite the rather heterogeneous distribution of age among the Centres), the results will be discussed in relation to the two main groups of at-term neonates and older children.
As the evaluation of neonate BAEPs does not require any correction for age, the methods used at our three Centres can be taken as the reference for normal BAEPs.
2. BAEPs Variability in Neonates
Our data showed that wave I was highly dispersed in neonates, and this dispersion was greater than the variability observed for wave V and IPL, as well as that observed in early infancy and childhood. This was partially independent of Centre and sample size, and so the effects of other non-pathological or technical factors need to be considered: for example, inaccurate measurements due to a low amplitude or noise-to-signal ratio or poor reproducibility.
The factors responsible for the variability observed in neonates and the differences in the maturation patterns of waves I and V have been investigated in a number of published studies. Early studies of normative BAEPs in neonates and early infancy (up to 18 months) first noted the different maturation patterns of waves I and V, and also emphasised the relevance of methodological criteria [2], that the peripheral structure of the hearing pathway is signifi-cantly more mature at birth than the central structures [3], and that the BAEPs in neonatesand three-month-old infants show remarkable variability in wave I latency, with a relatively stable I-V central conduction time (CCT) within the brainstem [4]. The greater variability of wave I in comparison with wave V and IPL I-V was studied in an experimental setting in which post-natal functional changes in the activity of the ear and auditory pathway was studied in neonatal guinea pigs; it has been observed and concluded that most of the changes in auditory function seen are due to absorption of amniotic fluid from the middle ear cavity [5]. Other studies have provided evidence of significant amplitude changes in BAEPs as infants grow [6], and of wave I variability by comparing pre-term with at-term neonates and sound intensity [7].
A multivariate approach to evaluate the relative effect of maturation, and pathological and other factors demonstrating the usefulness of BAEPs when monitoring brain function in high-risk neonates and indicate their potential in predicting developmental outcome [8].
Other studies have suggested that maturation of the basal part of the cochlea is relevant for this aspect of BAEP maturation in very early infancy [9], and that the brainstem auditory evoked response showed a statistically significant shortening (maturation) of the evoked response was only in relation to post-conceptional age [10].
As far as the the influence of head circumference is concerned, it was showed that this factor did not reduce interpeak variability of the normalised BAEP data [11].
Finally, the comparisons of pre- and at-term neonates have helped clarify some uncertainties concerning variability in the neonatal period. Serial changes in BAEPs represent a specific parameter that merits further study in premature infants as an index of neurological maturation [12, 13], as do the exact maturational changes in peripheral and central transmission in normal human subjects [13].
3. BAEPs Variability Over Neonates
As far as the BAEPs data over neonates were concerned, we found that the most critical period was from birth to early infancy, when BAEPs show remarkable changes in latency and IPL due to physiological maturation, and statistical analysis reveals also considerable intra- and inter-Centre variability probably due to: a) measurement accuracy; b) the criteria for selecting normality; and c) sample size. Accuracy of measurement is strictly related to the quality of the acquired data (i.e. the signal-to-noise ratio) and the measurement criteria (i.e. whether to measure each single trial or to average two or more traces). Subject selection and the inclusion criteria were critical as most of the recruited subjects were hospitalised children who were neurologically and audiologically normal; for example, one Centre (PD) used rigorous inclusion criteria and all of the subjects underwent extensive audiological examination; however, as no a priori normative data were available, this gave rise to an almost automatic over-selection that led to the paradox of finding shorter latencies in younger than in older subjects after correction by age. The other Centres used less rigid inclusion criteria in terms of preliminary audiological testing and recording quality, which probably increased the proportion of false negative data. Sample size was even more critical because of the lack of statistically based criteria for determining it. Only one Centre (MIBST) used a statistical procedure to characterise the variability of data related to sample size: one simple procedure measures standard error, which provides an indirect but reliable indicator as to whether it depends on sample size or other factors, and makes it possible to check the reliability of the sample.
Our late infancy and childhood findings indicated more stable BAEP latencies and IPL with considerably less intrinsic variability. Comparison of the methods used at the different Centres seemed to rule out the possible that click intensity may have affected BAEP variability. Gender seemed to play some kind of role because, regardless of age or Centre, females showed shorter absolute latencies and IPL, but the difference was slight and statistically not significant. It is worth mentioning that two of the Centres (RMBGS and MIST) had overlapping means and, for certain parameters, differences that could only be seen in the third decimal place, thus indicating the similarity and robustness of their results.
Our results confirm those of another study in which the maturation kinetics of BAEP latencies and IPL I-V recorded in 89 healthy children aged 0.1-52.1 months were well approximated by an exponential model with a horizontal asymptote; however, adult values were reached by about three years of age in that study, whereas we found them earlier; the authors also provided a non-fragmented reference range for interpeak latency I-V in the first years of life [14]. The possible effect of prematurity on BAEP maturation has also been investigated [15]. A retrospective, cross-sectional analysis found that the ontogeny of the BAEP component wave latencies was instead adequately described by two exponential curves with different slopes: a early and steeper curve representing rapid maturation, which ended 8-10 weeks post partum, and a subsequent more gradual curve corresponding to developmental events that were completed by the beginning of the third year of extra-uterine life [16].
Another study analysed a total of 200 BAEPs from 165 normal subjects ranging in age from infancy to young adulthood, and found that the maturation of BAEP waves and IPL was slower than our results suggest [17]. The results of a study on the influence of gender on BAEP latency and IPL indicate that the IPL V-I of males were longer than those of females in the different groups, and that females showed larger wave V BAEPs than males after two years of age. These data indicate that it is worth establishing separate latency and amplitude norms for males and females from infancy to adulthood in order to give BAEP measures diagnostic significance [13, 17].
The findings of a recent study comparing the maturational changes of BAEPs with those of the middle and late auditory components indicate that the development and maturation of the human auditory system seems to proceed in parallel at all levels from the middle ear to the cortex. [18].
The correlations between the functional and morphological maturation of the auditory pathway in pre-term and full-term infants, and children and adults, have been studied using histomorphometrically, and it was found that nerve cell density in the cochlear nucleus and inferior colliculus decreases with age, with the latter decreasing more slowly. Myelination in the lateral lemniscus continued from the late-fetal to the infantile period, with large-diameter myelin sheaths mainly increasing in infanthood [19].
Laffer and Wenzel [20] recorded BAEPs in 92 healthy children ranging from a gestational age of 35 weeks to 16 years. The maturation kinetics of IPL I-III and I-V could be well approximated by exponential regressions (I-V: y = 0.9588 x e -0.9215 x + 3.9728; r = 0.87, and I-III: y = 0.6182 x e -1.1737 x + 2.1759; r = 0.81). Adult values were reached by about the second year of life. Contrast with this immaturity of the central auditory pathways, the slopes of the latency/intensity functions of waves I and V showed no significant differences between premature infants/neonates and children aged more than three years: caused by the prolonged IPL I-V, wave V latency is about 1 ms longer in the first group, whereas wave I is only slightly prolonged (0.2 ms) during the first three months of life [20]). The data obtained in this study overlap our results, thus indicating the reliability of the pooled data approach.
4. Significance of the Multicentre Normative Data Comparison and Evaluation
Neurophysiological multicenter studies are expected to increase in the future and, consequently, the evaluations of normative data should be performed in order to verify their reliability and comparability. We have carried out the multicenter BAEPs study to investigate the possible causes of their variability and to verify the practical feasibility to build up a shared normative based on the collection of heterogeneous data. In this respect, the evaluation of the pooled data have suggested that the construction of a single model that satisfactorily predicted the values obtained in neonates is a satisfactory means of assessing normative data from a number of Centres.
The results of our study should not be considered as an end in itself, but as a starting point for improving data collection so to allow other laboratories to prompt a controlled methodology and thus improve the quality of the diagnostic procedures. Our data will be made available so that other laboratories can compare our data with their own findings. The comparative evaluation of each Centres data with the pooled data will allow the identification of those whose differences account for variability and possible clinical misinterpretations or discrepancies in multicentre clinical trials. More in general, and not only theoretically, our method can be more widely used to verify the clinical reliability of normative data in other fields of pediatric clinical neurophysiology.
The lesson we have learned were that each and every one of Centres that accepted to enter the study were unaware of a numbers of unintended drawbacks and that without the study they will be persisting. On the whole, the Centres have had an unique opportunity to overall improve their own skilfulness of the electrodiagnostic procedure. Our suggestion of that a preliminary evaluation of normative data should be carried out and should represent a prerequisite before enter, or to be eligible to, a multicenter clinical trial or investigation.