Molecular Mapping Alzheimer's Disease: MALDI Imaging of Formalin-fixed, Paraffin-embedded Human Hippocampal Tissue
Authors Info & Affiliations
Abstract
A method for the molecular mapping of formalin-fixed, paraffin-embedded human hippocampal tissue affected by Alzheimer's disease (AD) is presented. This approach utilizes imaging mass spectrometry (IMS) with matrix-assisted laser desorption/ionization (MALDI). The usefulness of this technique in comparing diseased versus nor mal tissue at the molecular level while continuing to maintain topological and morphological integrity is evident in the preliminary findings. The critical correlation of the deparaffination, washing, matrix deposition, and analysis steps in handling the tissue sections and how these steps impact the successful mapping of human hippocampal tissue is clearly demonstrated. By use of this technique we have been able to identify several differences between the hippocampal AD tissue and the control hippocampal tissue. From the observed peptide clip masses we present preliminary identifications of the amyloid-beta peptides known to be prominent in the brains of those with AD. We have obtained high-resolution mass spectra and mass images with 100μm spatial resolution. Future experiments will couple this work with MALDI LIFT experiments to enable top down proteomics of fresh frozen tissue, which is not possible with paraffin-embedded tissues.
INTRODUCTION
About 40 million people suffer from Alzheimer’s Disease (AD) on a global scale. AD is the leading cause of dementia [1]. It is well known that hippocampal formation in patients with AD exhibit neurofibrillary degeneration and neuritic plaques [2]. The amyloid cascade hypothesis is widely acknowledged as a pertinent pathogenic mechanism in AD. However, the inability of current methods to therapeutically target amyloid-beta has prevented any effects on clinical outcome. This suggests a certain level of complexity in the approach that has yet to be thoroughly understood. Various provisional explanations as to the growing variable relationship between pathology and clinical disease in AD have been presented. Some of these explanations include the notion of low-n mers of amyloid-beta (i.e. oligomers) and synaptic pathology. Despite their potential these explanations are still in the developing stages and have not yet been able to resolve any of the issues presently at hand. Provided with the differences in brain regions and topographical progression over time between amyloid-beta and phospho-tau in neurofibrillary degeneration it is likely that the relationship between these two proteins has yet to be entirely resolved. Therefore, in order to accomplish therapeutic targeting we must begin by improving upon our understanding of the molecular composition of the diseased tissue relative to the control, particularly in human brain tissue in vivo.
Analysis of tissue homogenates by use of mass spectrometry have been used in the past to determine the molecular composition of AD tissue [3]. Techniques such as liquid chromatography coupled to mass spectrometry (LCMS) have proved useful in determining the chemical makeup of the tissue but eliminate information that could be gained from cellular topology and morphology of the tissue in the process. Recent developments in mass spectrometry have made it possible to perform these tests while still retaining the spatial and relative molecular information of the tissue.
A brief overview of the history of investigations involving the roles of the amyloid-beta protein in AD as tissue homogenates using mass spectrometry is useful in understanding the significance of our present study [3]. In 2002, Stoeckli was the first to publish a paper on the distribution of amyloid-beta in the brain tissue of mice by matrix assisted laser desorption ionization (MALDI) mass spectrometry (MS). Stoeckli observed that the large mass differences between theoretical and experimental were the result of uneven tissue surfaces and possible charging effects of the tissue [4]. Wu et al. described specific proteins that likely take part in the aggregation of amyloid-beta in the brain in 2004. Wu and associates found that the protein band 16kDa that corresponds to α and β hemoglobin chains plays a part in this aggregation. These hemoglobin chains were found at the highest quantities in the hippocampus of AD patients. Identification of the 16kDa protein was accomplished by the utilization of LCQ ion trap MS coupled with high performance liquid chromatography (HPLC) from the PAGE gel separation [5]. In the same year, Rufenacht developed an approach for isolating and collecting individual plaques from brain tissue samples to be used for analysis via laser dissection microscopy followed by MALDI imaging mass spectrometry analysis. By studying the homogenate forms of mouse and human plaques it was determined that the number of amyloid in plaques obtained from transgenic mice and from humans were similar [6]. A year later, in 2005, Hutchinson came up with a technique that used laser ablation-inductively coupled plasma (ICP) mass spectrometry for the identification and visualization of amyloid-beta peptides in the brain samples of mice. ICP is usually used to analyze metals. Therefore, in order to use ICP for the analysis of proteins measurements were based off of Eu and Ni bonded antibodies [7]. Soderburg collected intact plaque cores from brain samples of humans suffering with AD and analyzed them using LCMS after they had been dissolved and digested. Soderburg discovered that amyloid-beta was the only protein present in the isolated plaques. Analysis of this observation provided for the conclusion that amyloid-beta may be the only protein that copolymerizes with the amyloid-beta in plaque cores [8]. In 2007, Stoeckli et al. imaged entire body sections of mice that were administered α- and β- peptides. By doing so they were able to determine that while the α-peptide degraded over time, there was retention of the β-protein [9]. In 2008, Seeley et al. obtained images from MALDI IMS for amyloid-beta data and then subsequently stained the tissue in order to see the plaques on tissue [10]. While there are no published investigations on the direct tissue imaging of human brain tissue from Alzheimer patients, in 2005, Rohner and co-workers were able to successfully image mouse brain tissue as a model of AD. Similar, as in our work, they selected the most intense mass signals to provide maps of and reported some of the same mass ranges that we were able to observe in the human AD tissue [10].
Mass spectrometry has also been used to investigate the tau protein which makes up the neurofibrillary tangles (NFTs) related to AD. In 2001, Lund et al. [11] investigated the phosphorylation of recombinant tau in humans by the use of tau protein kinase II. They were able to determine the extent of the phosphorylation using MS by measuring the change in molecular mass of the tau proteins over time [12]. A few years after his work with amyloid-beta proteins, Portelius utilized his previously mentioned method to study human CSF, this time to determine the presence of tau in CSF. He was able to distinguish and identity 19 tryptic fragments of tau in human CSF [13]. In 2005 and 2006, Ma published two different studies that focused on the properties of Cu-binding of R2 and R3 peptides (which come from tau), respectively. Both of these have an important role in the formation of NFTs. He found that Cu2+ is important in the aggregation of tau in the brain and that the binding may indeed have involvement in the development of AD [13, 14].
Potential biomarkers for AD that are not amyloid-beta or tau related have also been investigated using mass spectrometry. In 2005, Liao and co-workers [15] were able to co-isolate 488 proteins from plaques with LCMS and laser capture micro-dissection. They discovered that there were 26 more proteins found inside the plaque than there were outside the plaques, but still in the brain [16]. In 2006, Gozel et al. used LCMS and thioflavin-S stained SDS gels to resolve proteins and peptides in plaques. From this, hundreds of proteins and peptides were resolved from the samples. They isolated proteins that were predominantly enriched within plaques [17]. Most recently, in 2013, a group from Mexico led by Minjarez [17], isolated over 2000 NFT-related proteins from the human hippocampus. They sought to identify polypeptides that were in both isolated NFTs and total tissue homogenates, using mass spectrometry. They were able to identify 102 from the total homogenate and 41 from isolated NFTs [17].
Recently, tissue preparation protocols have significantly improved making it possible to map human tissue the same way. We report on developing a method of tissue preparation and analysis for paraffin-embedded human hippocampal tissue and then mass spectrometric analysis using imaging mass spectrometry (IMS) to map tryptic peptide clips localized in various regions of the human hippocampal tissue with AD and control conditions.
An on-tissue trypsin digest is performed in order to enzymatically digest proteins into identifiable peptide clips. Then, a systematic analysis of the entire piece of tissue in order to obtain, not only the chemical make -up of the tissue as with analyzing a tissue homogenate, but also a mass map of the tissue that relates the chemical composition to the morphology of the tissue is accomplished. This allows for a better understanding of where the plaques and tangles associated with the onset of AD are located in the brain and how they form and to determine if there is a regional variations in the makeup of the plaques which cannot be determined from optical microscopy. The process by which the tissue sections were prepared for analysis proved imperative in the gathering of the proposed data.
MATERIALS/METHODS
Brain Tissue
Human brain tissue was obtained from autopsy cases from the National Institutes of Health Neurobiobank at the University of Maryland. All tissues obtained from the Neurobiobank are approved for use by the Institutional Review Board. The Alzheimer disease tissue was obtained from an 80 year old man with a long history of dementia, and advanced Alzheimer’s disease pathology according to National Institute on Aging - Alzheimer Association 2012 guidelines. No co-morbid processes such as Lewy body dementia, vascular dementia, or frontotemporal lobar degeneration were present. Control tissue was obtained from a 48 year old man who died suddenly of non-neurological process. Brain tissue for both subjects were analyzed for apolipoprotein E genotype using standard methods (PCR and restriction enzyme analysis) and both subjects were determined to be APOE 2/3, a genotype considered protective against the development of AD. Tissue selected for examination was hippocampal formation at the level of the lateral geniculate nucleus, which also included subiculum and inferior temporal neocortex, although the control sample is slightly more anterior in the coronal plane, which accounts for the differing architecture in the dark field microscopic (Figs. 7 and 8). Tissue was fixed in buffered 10% formalin for 10 days and subsequently dehydrated in graded ethanol, xylenes and finally embedded in paraffin [18].
Reagents
Ethanol, chloroform, acetic acid, xylenes, ammonium bicarbonate, and acetonitrile were purchased from Fisher Scientific. 2,5-dihydroxybenzoic acid (DHB) was purchased from Sigma Aldrich. MS Grade Trypsin was purchased from Pierce [18].
Trypsin Preparation for Digest
100 μg of trypsin powder was reconstituted by addition to 200 μL of 50 mM glacial acetic acid which produced a stock solution of 0.5 μg/μL. The solution for digest was prepared by the addition of 100 μL of the stock solution to 500 μL of 100 mM ammonium bicarbonate and 60 μL of acetonitrile in water [18, 19].
Tissue Preparation for MALDI Analysis
Tissue sections were cut and mounted on indium tinoxide (ITO) conductive glass slides (Delta Technologies Part No. CG-81IN-S115) at The University of Maryland School of Medicine at a thickness of 12 μM. All slides were stored at room temperature until ready to be analyzed. The depariffination procedure was completed by washing the slide in xylene followed by an additional fresh xylene wash for 3 minutes each. Then the slide was washed in 100% ethanol twice for one minute each, 95% ethanol for 1 minutes, 70% ethanol for one min ute and water twice for 3 minutes each. Next, the slides were washed with a series of solvents in order to remove the salts and lipids from the tissue facilitating protein/peptide analysis via MALDI IMS. Sections were washed systematically in plastic Petri dishes with 70% and 100% ethanol for 30 seconds each, Carnoy’s fluid for 2 minutes, and 100% ethanol, water, and 100% ethanol for 30 seconds each [20]. Upon completion of the washing step, a trypsin (MS-grade) digest was performed on the intact tissue by hand pipetting the trypsin solution onto the tissue and allowing it to dry twice [18].
Matrix Deposition
Prior to application of matrix, an image of the slide was taken with an Epson Perfection V37 flatbed scanner to be used in the imaging process. Matrix deposition was carried out by sublimation. Oil was heated to 110 -120 ºC before sublimation was carried out [20]. The slide was taped to the apparatus with conductive copper tape. 0.300 g of DHB was deposited into the apparatus and the sublimation was carried out under vacuum for 14-16 minutes in order to achieve a matrix coating of optimal thickness and homogeneity [18].
Several prior studies have investigated the MALDI IMS of FFPE tissue [21]. All recognize the difficulties and discuss potential strategies to make the analysis and protein/peptide identification easier and more reliable. Cross-linking of proteins by formalin-fixation causes modifications and adducts due to methylol adducts, Schiff bases, and methylene bonds [21]. Many researchers recommend an antigen retrieval step in which the tissue is heated up in a buffer in order to facilitate de-linking of proteins before an enzymatic digest is done [22, 23]. While this seems to address the problem in the sense that you do indeed see more fragments after digest, the buffer identity, time of experiment, and temperature all widely vary depending on tissue type and age. According to Gorzolka and Walch in their review article on the MALDI imaging of FFPE tissue, even upon antigen retrieval, which accounts for the methylene bonds produced by fixation, you still must account for possible mass shifts due to Schiff bases and methylol adducts. These two groups may be enough to disallow for optimal enzymatic digest by blocking protein cleavage sites. Accounting for this reduces the accuracy from the database searches, Gorzolka and Walch insist [21]. Control case tissue (right). Spectra were taken from regions on tissue with a high intensity of m/z equal to 2709.
Rehydration
Immediately before MALDI IMS analysis, the sublimated slides were subject to a rehydration step in order to draw the analytes into the matrix layer. This step was necessary because of the dry matrix coating technique used. The slide was taped to the top portion of a Petri dish with conductive copper tape and a piece of paper towel was put in the bottom portion with 1 mL of water and 50 uL of acetic acid [20]. The Petri dish was taped closed and put in an oven at 85 ºC for 3.5 minutes. The time seemed to be a very important consideration in this step. Too long in the oven and the slide would become far too wet and too little time in the oven would not allow for enough of the analyte to be drawn out [18].
MALDI Imaging
Mass spectrometric analysis was done in linear, positive ion mode on a time-of-flight spectrometer (Bruker Ultraflextreme; Bruker Daltonics, Bremen, Germany). Various parameters were optimized to maximize signal intensity and mass resolution before any imaging experiments were conducted. Some of these parameters include the pulsed ion extraction and the laser intensity, as well as the number of shots at what frequency and the smartbeam parameter set.
The pulsed ion extraction setting was optimized and set at a constant 300 ns with a fairly constant laser setting at roughly 24% with a global attenuator offset of 70%. The number of shots was set to 500 shots at 1 kHz. The smartbeam parameter was set to large, ion source 1 was held at 25 kV and ion source 2 was kept at 23.7 kV with the lens at 6.5 kV. A peptide mixture obtained from Bruker was used as a calibration standard which contained angiotensin II (M+H+ = 1047), angiotensin I (M+H+ = 1297), substance P (M+H+ = 1348), bombesin (M+H+ = 1620), ACTH clip 1-17 (M+H+ = 2094), ACTH clip 18-39 (M+H+ = 2466), Somatostatin 28 (M+H+ = 3149). Mass spectral data was acquired over the entire human hippocampus sections using FlexImaging software (Bruker Daltonics, Bremen, Germany) in the mass range between m/z 1,000 to 18,000 Da with a raster step size of 100 um and 500 laser shots per spectrum [18].
RESULTS/DISCUSSION
The procedure that we have developed through modifications of previously published methods [3, 8, 20] demonstrates the ability of IMS to differentiate between AD and controls giving both molecular and spatial information. Tissue homogenate work has been done primarily on the amyloid-beta protein which, in AD cases, is the major protein component of senile plaques in AD and aging. Peptide fragments of the protein show exaggerated amounts in the brains of those with AD, specifically that of Aβ1-40 and Aβ1-42. While we have yet to locate the fully intact Aβ1-40 and Aβ1-42 within the tissue because of the tryptic digest necessary for preparing the paraffin-embedded tissue, we have been able to locate and identify several potential protein fragments that show increased intensities in the AD sample as compared to the control sample. Because of the vast availability, the tissue type, and the stability, we received formalin-fixed paraffin-embedded (FFPE) brain tissue samples with which to undertake our experiments. Formalin-fixation works to cross-link the proteins within the tissue sample. Because of this, upon depariffination and rehydration, enzymatic digest yields peptide clips that are not typical of the in-tact proteins they represent making it difficult to determine protein identification by standard MS/MS database searches. Therefore, we turned to the in-silico (computer generated theoretical) trypsin digest of amyloid-beta, peptide clips which are known to be within the hippocampus and surrounding areas of not only AD brains, but also, to a much lesser extent, in the brains of healthy individuals. This provided the control. The similar peaks seen in the AD and the control tissue and the reproducibility seen in multiple tissue samples from the same two patients show a preliminary correlation in the way cross-linked proteins denature. We correlated 6 of the potential fragments to their corresponding molecular images. While more masses may have been matched, only the most prominent were used because of the higher probability of being related to the non- cross-linked protein fragments.
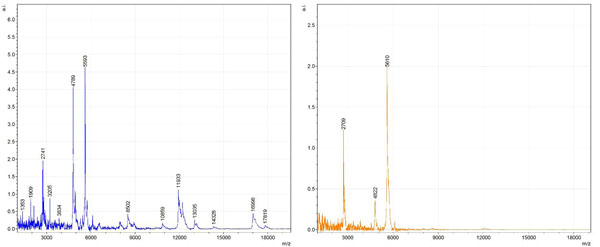
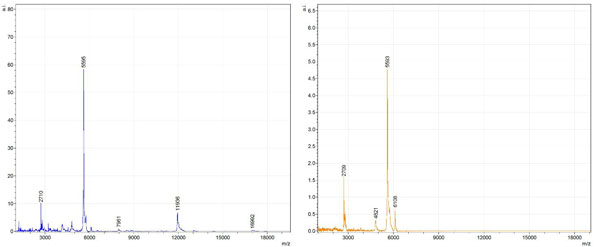
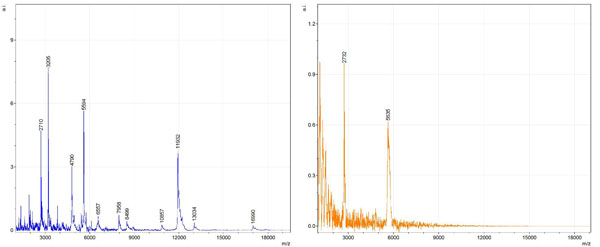
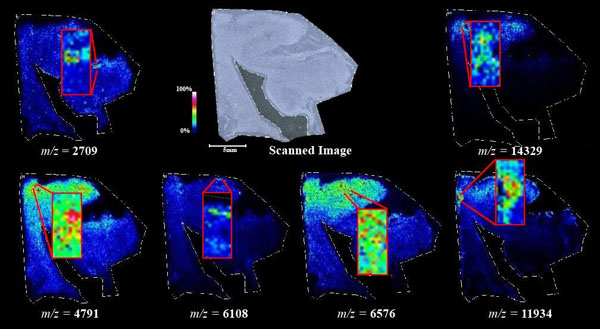
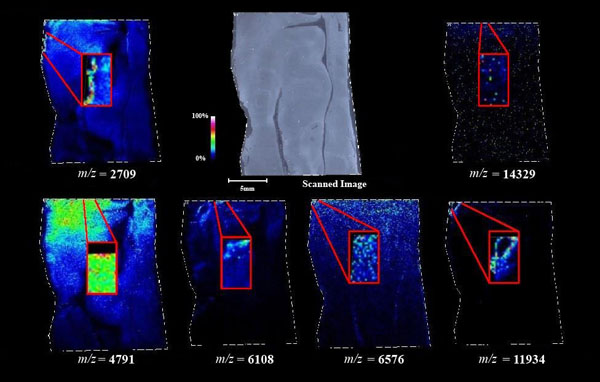
Figs. (1-6) show a set of 12 different mass spectra. Half of these are from AD tissue (left side) and the other half (right side) represents the control tissue. None of the observed peaks matched the commonly reported Aβ1-40 and Aβ1-42 clips usually associated with AD. This is not unexpected because this is a trypsin digest of formalin-fixed cross-linked proteins. An enzymatic (tryptic) in silico digest of the fully-intact amyloid-beta protein was completed using mMass [24-26], however no matches were identified between the known tryptic fragments of the protein and our samples. This is more-than-likely due to the cross-linking from the formalin-fixation of the tissue which causes a digest not equivalent to the digest of a fresh-frozen tissue sample. The software has another sequencing option that generates all common peptide fragments of a given protein [24-26]. We used this peptide fragmentation option and found matches based on common peptide clips. Six of the masses from the in silico peptide fragmentation matched prominent peaks observed in the MALDI mass spectra from the AD tissue. These matches the following clips: (749-770) (sequence y22-NH3), (730-770) (sequence y41), (719-770) (sequence y52-NH3), (1-62) (sequence b62- H2O), (1-108) (sequence a108-NH3), and (642-770) (sequence y129). A mass filter corresponding to each mass is shown in Fig. (7) (AD) and Fig. (8) (control). The scale, seen on each figure shows the intensity of the certain mass, shown by different colors (black and dark blue corresponding to the lowest intensity and pink and white corresponding to the highest intensity). A zoom-in of the spots from which the sample spectra Figs. (1-6) were taken shows that the spot had a relatively high abundance of the analyte with the selected mass.
In order to be able to compare relative intensities of two different tissues run at different times, it is imperative that certain things be maintained. All tissue sections were prepared the same for analysis with consistent depariffination, washing, digestion, sublimation, and rehydration steps. Also, all MALDI parameters were kept consistent. In addition, before each run, the machine was calibrated with the peptide standard discussed in the experimental section. The relative intensities of these calibrations were very similar before each tissue sample was run. This makes it possible to relate the intensities of the mass spectra from the imaging runs. It is important to note that a side-by-side comparison of undigested tissue with the tissue digested with trypsin showed none of the same peaks in the undigested tissue. In fact, the spectra collected from the undigested tissue showed no distinguishable peaks. This is due to the heavy cross-linking of reactive amino acids from the formalin fixation process.
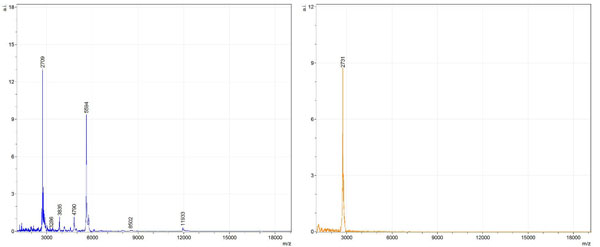
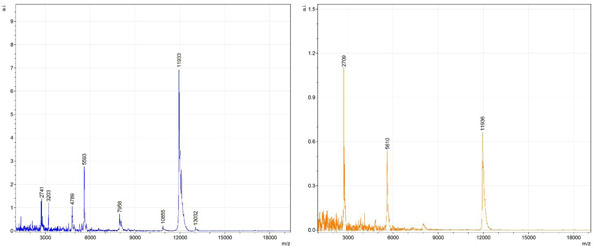
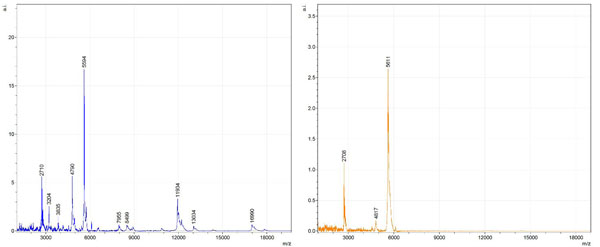
By examining Fig. (1), noticeable differences are apparent. The main set of peaks around m/z 2109 are more intense in the AD sample than in the most intense region from the control tissue. This is shown by the intensity scale in arbitrary units on the y-axis of the spectra (a relative intensity of 15 vs. roughly 5). Along the same lines, there are also several peaks, specifically at m/z equal to 3835, 4790, and 5594 that are apparent in the spectra of the AD but not in that of the control tissue. This alone clearly demonstrates that IMS can be used to differentiate between AD tissue and non-AD brain tissue. For the remaining sample masses, the same procedure was completed. The six masses assigned, were not the only masses that were seen. There are obvious masses seen in the control that are not seen in the diseased tissue and vice versa, however, these six masses were good for means of comparison. They showed up in both tissue types and one would expect to see amyloid-beta in control tissue albeit at a much lower intensity. This is the basis for the potential quantitation of these compounds in tissue. Also, the differences in intensity can be due further to the age and disease stage of the patients. An 80 year old man with a long history of the disease is bound to show amyloid-beta to an extent much greater than a 48 year old man without the disease would.
These experiments were run on a TOF instrument in linear mode. This is a lower resolution operating mode of the instrument which can result in the observed 1 to 2 Da shifts in the reported masses for the same compounds, as seen in Figs. (1-6). This is then compounded in IMS because of differences in tissue thickness across large tissue sections such as those used in these experiments. The fact that these shifts result from the TOF and not different compounds is shown by the fact that all peaks are shifted by the same amount.
To further characterize these as potential amyloid-beta fragments and not another predominant complex seen in AD brains, the same in silico peptide fragmentation experiment was done with the sequence of tau. Neurofibrillary, or tau, tangles are another common feature in the brains of Alzheimer’s patients [2]. We saw no matches to our observed masses within the same tolerance (+/- 0.3 Da) as with amyloid-beta. At a tolerance of +/- 1 Da we saw one potential tau fragment match. All fragments do not appear in equal intensity or in the same locations on the tissue which might be expected for fragments of the same protein. However, we do expect there to be more compounds within the two tissue types other than just amyloid-beta. Because of the morphology of the tissue, we do not expect all fragments to appear equally in all parts of the tissue. If all fragments are not in all parts of the tissue, we would not see all fragments in every spectra. We do see a consistency with m/z 11329, 4791, and 2703 as showing up in the majority of the spectra collected, however.
An image map was created for each mass on both AD tissue and non-AD tissue shown in Figs. (7 and 8). Again, the sample spectra for Figs. (1-6) were taken from regions with a high abundance of an analyte matching that mass. These spectra were then compared to one another. It was not only determined that the target mass was found with high intensity in the AD tissue but that they were also found at very low intensities in the non-AD tissue. One would expect to see this if these were indeed clips of proteins such as amyloid-beta that are found in normal brain tissue as well as in diseased brain tissue. However, since this protein makes up the majority of the senile-plaques that are identifiers of the disease, a higher intensity should be seen in AD tissue.
This same trend can be seen viewing the images in Figs. (7 and 8). The blue areas show some minimal abundance for those selected masses. This blue color can be seen in both the AD tissue and the control tissue. The more intense colors of lighter blues, greens, yellows, reds and even pinks show a much higher abundance of the masses. Of course, this is all relative to the specific slice of tissue. For example, just because something seems to be of the same high abundance in the control tissue as in the AD tissue, the sample mass spectra show that this is only because the scale is representative of the tissue section itself and cannot be compared to other sections. With some images, especially with the zoom in though, it is easier to compare the AD tissue and the control tissue in not only the intensities (colors) shown but also the uniform distribution of the masses across the tissue, the more pixilated the image, the less intense the signals (the last 3 control images). It is also important to note here that all images and mass spectra were taken from one control tissue run and one AD tissue run. Other runs of each tissue showed very similar images and spectra and therefore, this data can be said to be representative of AD and control samples in general. The overall distribution of the compounds shown by the images in Figs. (7 and 8) can be related to AD pathology. Amyloid-beta is most commonly found within the grey matter of the brain and is not found in the white matter of the brain. The parts of the tissue where the peptide fragments are localized are indeed grey matter-rich portions of the section. In addition, the tissue sections are from the middle grey matter layers of the brain in which one would most likely find amyloid-beta build-up in AD patient brains. These are very anterior cuts, as stated before, and the AD tissue involves slightly more tissue than just the hippocampus. The hippocampus is located toward the bottom of the tissue slice and it is known that the hippocampus is less amyloid-beta rich than the adjacent cortex of the brains of AD patients [27]. That section of the tissue has very limited amounts of the matched compounds which would be expected.
CONCLUSION
IMS has allowed the observation of several different potential peptide fragments of the amyloid-beta protein alongside other masses which have yet to be identified. This has provided a novel imaging technique for the analysis of human brain tissue for a better understanding AD and how AD brains differ from normal brains. We were able to observe peptide fragments at m/z equal to 2709, 4791, 6108, 6576, 11934, and 14329 at significant intensities and the possible identities of these peaks were accomplished by simulated fragmentation of the fully intact amyloid-beta protein using mMass. The full-length amyloid-beta protein sequence was fragmented using in-silico fragmentation in mMass and a list of all common peptide fragments were given. The matching software used the peaks picked and searched through the possible fragments for matches within +/- 0.3 Da of the actual mass. These matches were shown to be clips of the protein with identities: (749-770) (sequence y22-NH3), (730-770) (sequence y41), (719-770) (sequence y52-NH3), (1-62) (sequence b62- H2O), (1-108) (sequence a108-NH3), and (642-770) (sequence y129).
Side-by-side viewing of the images associated with each of the aforementioned masses and clips show not only more intensely colored regions but also a more homogenous coverage of the tissue in the AD sample as opposed to the control samples. The mass spectra data from sample spots of each image corresponding to a different peptide clip shows increased intensity of each of the peaks associated with amyloid-beta fragments in the AD tissue than in the control tissue; however, there is still some evidence of the peptide fragments in the control tissue, at much lower intensities, which would be expected even in non-AD brain tissue.
The overall localization of the observed peptide fragments within the tissue relate directly to AD pathology. There are certain observed peptide fragments prevalent in the AD case that are either not seen, or seen at a much lower intensity than in that of the control. This alone proves this technique useful in the eventual mapping of brain tissue with protein biomarkers specifically associated with AD. This method has been shown to be an accurate and meaningful way in which to analyze human brain tissue without breaking the morphology of the tissue and to obtain a full mass map of the tissue in question. This work will open doors to more imaging projects for AD and human tissue in general.
CONFLICT OF INTEREST
The authors confirm that this article content has no conflict of interest.
ACKNOWLEDGEMENTS
This work was supported by grants from the National Institute on Minority Health and Health Disparities (G12MD007591). The MALDI TOF/TOF work was supported by the National Science Foundation under CHE-1126708. Work was also supported through the Semmes Foundation (Kelley and Perry). The tissue sections were supplied by the NIH NeuroBioBank.