All published articles of this journal are available on ScienceDirect.

Onset Latency of Motor Evoked Potentials in Motor Cortical Mapping with Neuronavigated Transcranial Magnetic Stimulation
Authors Info & Affiliations
Abstract
Cortical motor mapping in pre-surgical applications can be performed using motor evoked potential (MEP) amplitudes evoked with neuronavigated transcranial magnetic stimulation. The MEP latency, which is a more stable parameter than the MEP amplitude, has not so far been utilized in motor mapping. The latency, however, may provide information about the stress in damaged motor pathways, e.g. compression by tumors, which cannot be observed from the MEP amplitudes. Thus, inclusion of this parameter could add valuable information to the presently used technique of MEP amplitude mapping. In this study, the functional cortical representations of first dorsal interosseous (FDI), abductor pollicis brevis (APB) and abductor digiti minimi (ADM) muscles were mapped in both hemispheres of ten healthy righthanded volunteers. The cortical muscle representations were evaluated by the area and centre of gravity (CoG) by using MEP amplitudes and latencies. As expected, the latency and amplitude CoGs were congruent and were located in the centre of the maps but in a few subjects, instead of a single centre, several loci with short latencies were observed. In conclusion, MEP latencies may be useful in distinguishing the cortical representation areas with the most direct pathways from those pathways with prolonged latencies. However, the potential of latency mapping to identify stressed motor tract connections at the subcortical level will need to be verified in future studies with patients.
INTRODUCTION
Neuronavigated transcranial magnetic stimulation (nTMS) is a rather new application for pre-operative planning in neurosurgery; this technique can locate and outline functional motor areas on the cortex in noninvasive manner [1-5]. The basic concept of nTMS is that the head of the study subject is coregistered with the subject-specific magnetic resonance image (MRI). This makes it possible to focus the stimulation to the desired cortical area with a precision of a few millimeters [6]. Results obtained with nTMS have been determined to agree well with those obtained with intraoperative direct cortical stimulation, which is an invasive procedure, currently acknowledged as the gold standard for functional mapping [2]. According to previous studies, in motor mapping nTMS is more consistent with direct cortical stimulation than magnetoencephalo-graphy [4] and functional magnetic resonance imaging [7], which are other commonly used non-invasive mapping methods.
The advantages of the use of pre-operative nTMS have been demonstrated, i.e. it has a positive impact on the surgical outcome in tumor surgery [8]. In nTMS, the functional motor area is outlined by separating the cortical muscle representations which induce a functional response in the vicinity of the area to be operated from those for which no detectable responses are acquired. This routine has been utilized recently to quantify the representation size [9]. By using a quantitative approach for the location, the motor areas could be assessed using centre of gravities (CoGs) which reflect the spatial average of the corticomotor representation [10, 11]. Recent studies have been able to make clear distinctions in the motor cortical representation maps between different muscles and muscle groups following a general somatotopic approach as well as mapping the extent of the cortical representations [3, 9, 12-14].
In previous studies, the muscle-specific motor maps have been conducted with nTMS-induced motor evoked potential (MEP) amplitudes [9, 12, 15, 16]. Another typical MEP-related parameter is the latency; which remains relatively stable across responses, whereas the MEP amplitude exhibits extensive variation from stimulus to stimulus [17-19]. However, MEP amplitude and latency are indicative of different characteristics of the cortico-spinal motor tract [20]. In contrast to the MEP amplitude, which provides information about the location of the most dominating neuronal populations associated with the target muscle, the MEP latency provides evidence of the most direct pathways with short latencies and pathways under stress with a prolonged latency. Ideally, in neurosurgical applications, the MEP latency could provide information about stressed or damaged neuronal pathways such as those affected by tumors. These neuronal pathways may be lower in the motor tract, not only in the cortex in the vicinity of the tumor [21]. In addition, the prolongation of MEP latency may be an evidence of potentially pathologically affected cortico-cortical connections. Hence, the determination of latency could add valuable information to the presently used application of nTMS in pre-surgical mapping.
Cortical stimulation is known to induce multiple successive excitatory efferent volleys in the corticospinal axons, which are observed as an initial direct wave (D-wave) followed by several indirect waves (I-waves) [22, 23]. The variation in nTMS-induced MEP latencies is explained by the timings of the arrival of the different volleys (D- and I-waves) to the spinal motoneurons [24]. Therefore, the variability in MEP latency at different scalp locations, i.e. cortically focused locations stimulated via nTMS may be determined by the number of evoked I-waves, meaning that the MEPs with the shortest latency are likely induced with D-waves or the first I-waves [25].
From a methodological perspective, the MEP latency is influenced not only by the coil location [24], but also by the coil direction with respect to the underlying anatomy [25, 26] as well as by the stimulation power [24], much like the MEP amplitude [19, 27-29]. The MEP latencies tend to be shortest at the centre of the motor maps [10, 24, 30], where commonly MEPs with the highest amplitudes are also detected. With nTMS, the MEP latencies have been shown to be slightly shorter than with non-navigated TMS, presumably due to the added information of the underlying cortical anatomy [31]. In this study, we used nTMS to evaluate the potential of MEP latency in functional cortical mapping. In addition, we compared the CoGs of latency and amplitude maps.
MATERIALS AND METHODOLOGY
Ten healthy right-handed volunteers (5 females, 5 males, age range: 21-32 years) with no history of neurological disorders participated in the study. Written informed consent was collected from all the subjects and the study was approved by the local ethics council (1/2014). Single-pulse nTMS mapping was conducted with eXimia navigated TMS system (version 3.2.2, Nexstim Plc., Helsinki, Finland) using a biphasic figure-of-eight coil. MEPs were measured with surface electromyography (EMG) from the left and the right hand first dorsal interosseous (FDI), abductor pollicis brevis (APB) and abductor digiti minimi (ADM) muscles using an integrated EMG device.
The measurement was started by performing a rough cortical mapping to identify the location and coil direction eliciting the maximum amplitude MEPs for FDI with a marginally suprathreshold stimulation intensity. From the cortical FDI target, the resting motor threshold (rMT) was determined with the TMS Threshold Assessment Tool 2.0 [32, 33]. Thereafter, the motor representations for FDI, APB and ADM were mapped using a stimulation intensity of 110% of rMT of FDI. Mapping was done twice; with and without a grid (0.5cm x 0.5cm) in a randomized order. Outlining the motor representation was started from the optimal FDI representation and then extended until MEPs were no longer induced in any of the recorded muscles. During the mapping, the orientation of the induced electric field was kept perpendicular to the nearest sulcus (Fig. 1). One single-pulse was given at each point/each grid cell with an inter-stimulus interval of 5–10s. The order of the mapped hemispheres was randomized. MEP amplitudes and latencies were marked semi-automatically in eXimia software and were further analyzed with Matlab (version 2013b, Mathworks Inc., Natick, MA). MEPs with preceding muscle contractions were rejected.
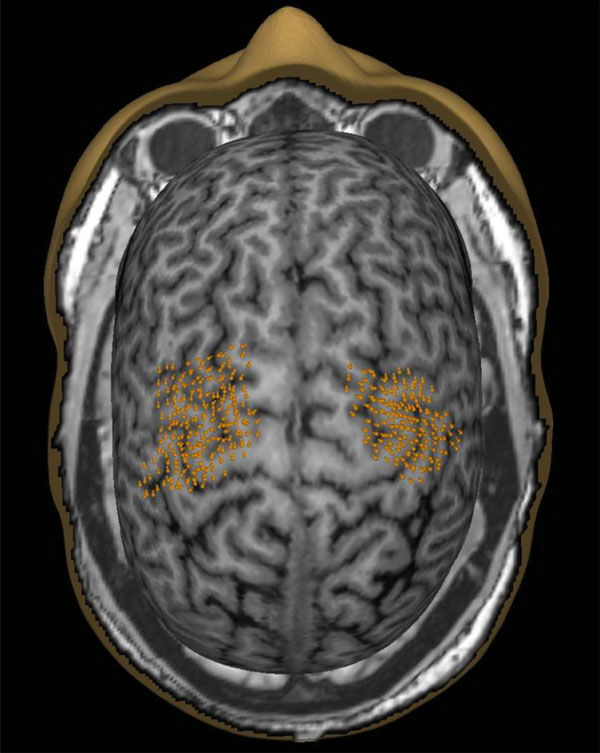
An example of the nTMS mapped cortical motor representations in both hemispheres (data pooled from mapping with a stimulation grid and without the grid). The orange points indicate the targeted cortical sites as well as the orientation of the coil.
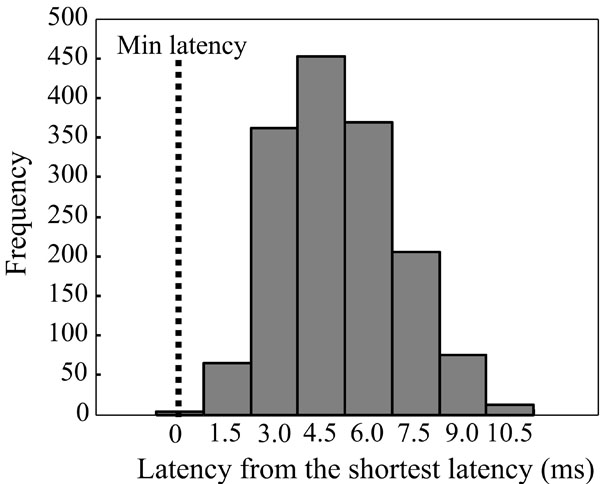
MEP latencies shown from FDI as absolute values from the group shortest latency (pooled data from both hemispheres). Bars are shown at 1.5 ms latency intervals.
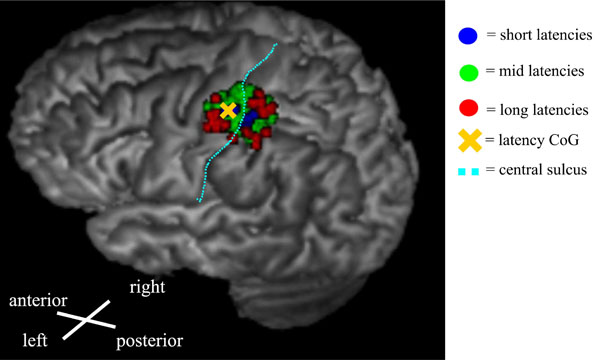
An example of a latency map from the right-hand FDI muscle showing the distribution of different latency groups. The evaluated categories were short latencies (blue): Shorter than 1 SD below the mean, mid-latencies (green): mean ± 1 SD, and long latencies (red): Longer than 1 SD above the mean. The short latencies were centered in the middle of the map, whereas the longest latencies were distributed near the edges of the map.
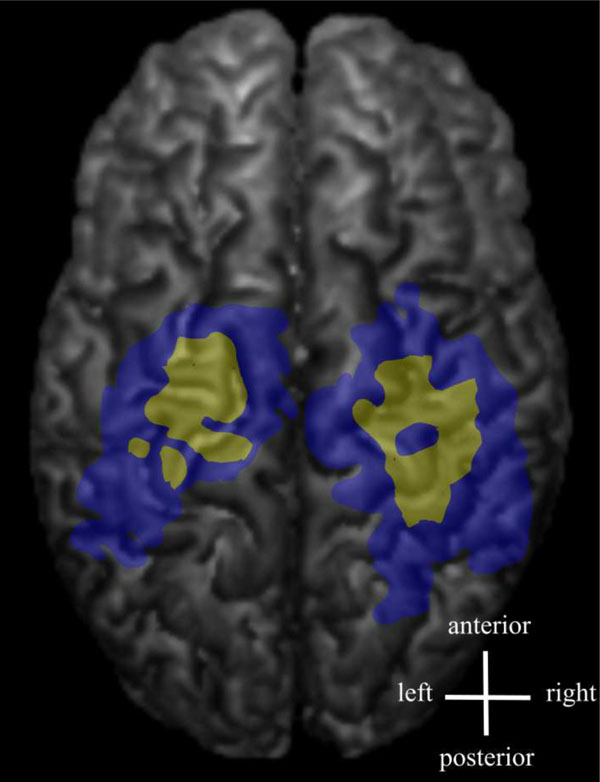
Some of the latency maps had a few separate short latency centres. Latency maps (yellow) and amplitude maps (blue) are shown from an individual FDI muscle data.
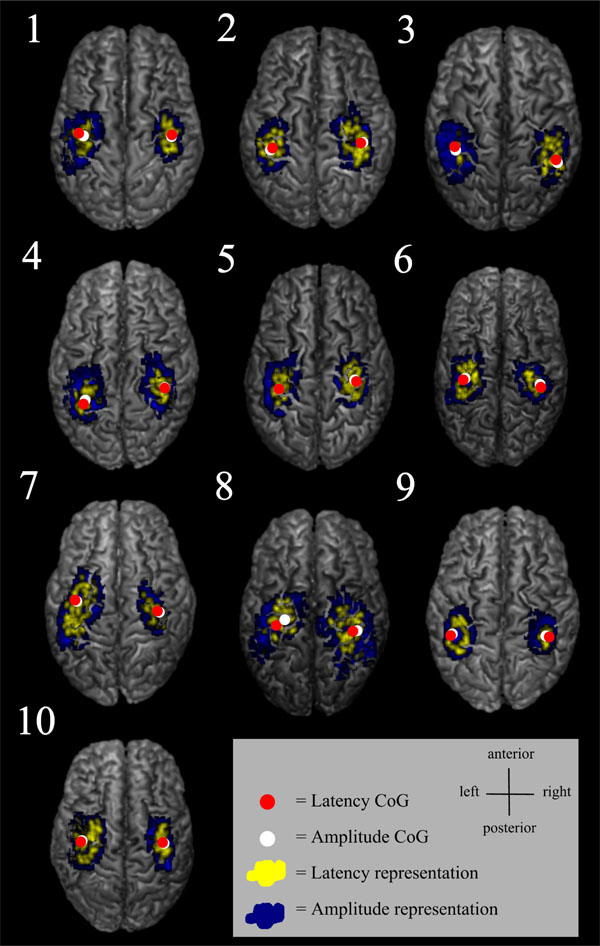
Individual MEP latency and amplitude representations from FDI, as well as latency and amplitude CoGs overlaid on individual structural MRIs.
Individual values as well as group mean and standard deviation (SD) related to latency and amplitude representations from FDI muscle.
| ID | rMT L hemis (% of MSO) | rMT R hemis (% of MSO) | Lat L hemis, mean, SD and range (ms) | Lat R hemis, mean, SD and range (ms) | Lat area L hemis (cm2) | Lat area R hemis (cm2) | Amp area L hemis (cm2) | Amp area R hemis (cm2) | Lat to amp area ratio L hemis | Lat to amp area ratio R hemis |
|---|---|---|---|---|---|---|---|---|---|---|
| 1 | 29 | 31 | 23.6±1.5 [21.0, 29.3] |
23.6±1.2 [21.3, 27.7] |
1.3 | 2.3 | 4.6 | 3.6 | 0.28 | 0.65 |
| 2 | 41 | 45 | 21.8±0.8 [20.0, 23.3] |
21.3±0.9 [19.0, 24.3] |
1.3 | 3.2 | 3.0 | 5.8 | 0.42 | 0.55 |
| 3 | 48 | 48 | 23.9±1.4 [18.7, 27] |
23.9±1.3 [21.7, 27.3] |
0.1 | 2.6 | 5.7 | 5.7 | 0.03 | 0.45 |
| 4 | 33 | 37 | 22.3±1.3 [19.0, 24.7] |
23.2±1.4 [20.3, 26.3] |
1.1 | 1.9 | 4.2 | 4.6 | 0.26 | 0.43 |
| 5 | 29 | 35 | 23.3±1.1 [20.3, 26.7] |
23.8±0.9 [21.3, 26.7] |
2.2 | 2.7 | 7.0 | 5.6 | 0.31 | 0.48 |
| 6 | 42 | 51 | 23.5±1.2 [21.0, 27.3] |
23.0±0.9 [21.0, 25.0] |
3.5 | 1.3 | 7.4 | 3.4 | 0.48 | 0.37 |
| 7 | 41 | 46 | 22.2±1.2 [19.7, 26.3] |
22.0±1.0 [19.7, 24.0] |
5.5 | 1.5 | 11.5 | 3.8 | 0.48 | 0.38 |
| 8 | 41 | 36 | 24.1±1.5 [20.7, 28.3] |
23.0±1.5 [20.0, 27.0] |
1.9 | 3.8 | 7.2 | 9.7 | 0.26 | 0.40 |
| 9 | 30 | 32 | 26.9±1.1 [25.3, 29.3] |
26.9±1.1 [22.7, 29.0] |
3.5 | 0.2 | 5.4 | 3.8 | 0.65 | 0.06 |
| 10 | 34 | 37 | 25.3±1.0 [23.3, 28.3] |
25.7±1.0 [22.3, 29.3] |
4.1 | 1.2 | 9.0 | 4.5 | 0.46 | 0.28 |
| Group mean and ±SD | 37±6 | 40±7 | 23.8±1.9 | 23.6±1.9 | 2.5±1.6 | 2.1±1.0 | 6.5±2.4 | 5.1±1.8 | 0.36±0.16 | 0.41±0.15 |
| p-value | 0.032 | 0.788 | 0.636 | 0.190 | 0.665 | |||||
p-values assessing the inter-hemispheric differences are determined using paired samples t-test.
L=left, R= right, lat=latency, amp=amplitude, hemis=hemisphere, MSO=maximum stimulator output.
Group mean and ±Standard Deviation coordinates for latency and amplitude CoGs.
| Latency CoG | Amplitude CoG | |||||||||||
|---|---|---|---|---|---|---|---|---|---|---|---|---|
| Left hemi | Right hemi | Left hemi | Right hemi | |||||||||
| Muscle | x | y | z | x | y | z | x | y | z | x | y | z |
| FDI | -32.5±3.7 | 95.7±6.8 | 26.4±10.9 | 34.7±3.3 | 95.1±6.9 | 27.7±8.3 | -32.9±3.5 | 95.5±7.2 | 26.3±9.7 | 34.6±3.1 | 95.1±6.5 | 27.9±8.7 |
| APB | -32.9±3.4 | 95.5±7.0 | 26.2±10.1 | 34.5±3.1 | 95.2±7.1 | 27.8±8.5 | -33.2±3.6 | 95.3±7.3 | 26.4±9.7 | 34.8±3.3 | 95.0±7.1 | 27.6±9.1 |
| ADM | -31.8±3.0 | 96.6±6.6 | 25.9±10.1 | 33.9±3.0 | 96.3±6.8 | 25.8±8.0 | -31.8±2.9 | 96.6±6.8 | 25.6±10.0 | 33.7±2.9 | 96.1±6.7 | 27.0±8.6 |
Data is presented from recordings of FDI, APB and ADM muscles (x=medial-lateral, y=inferior-superior, z=anterior-posterior). The SD was smallest in the medial-lateral direction in all of the evaluated muscles.
Centre-of-gravity and representation size
Recently, a method was developed to compute the CoG and to outline the motor cortical representation area by using a spline interpolation technique [9]. This method was applied to assess both latency and amplitude representations. In this technique, the stimulation locations were first converted from 3D space to 2D space by fitting an ellipsoid to the cortical stimulation locations by utilizing singular value decomposition. To increase the spatial coverage in the analysis, data obtained with and without a stimulation grid was pooled. The spline interpolation was implemented by computing another grid with 0.1 mm spacing that covered all stimulus locations on the cortical surface. The MEP latency/ amplitude values were then calculated on the new grid, applying spline interpolation. Here, the method was used to evaluate the spread of MEP latencies within the MEP amplitude map and to determine the CoG of each muscle. The shortest latencies were considered to bear more weight than their longer counterparts [24, 30]. The latency CoG on the cortical surface was therefore computed with inverse values of the latency according to equations 1 and 2.
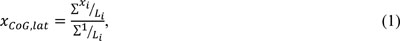
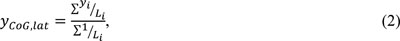
where xiand yi are the coordinates of each stimulation location on the cortical surface and Li is the corresponding MEP latency. With MEP amplitudes, the CoG was determined in a similar manner (equations 3 and 4), but the highest weight was allocated to the largest amplitudes [24, 30].


where xi and yi are the coordinates of a stimulus site i, Mi and is the MEP amplitude of that location. In the statistical analysis, the CoG coordinates were transformed from 2D cortical surface coordinates to 3D MRI coordinates, corrected for different head positions between the subjects. For the amplitude maps and corresponding CoGs, all the accepted MEP amplitudes (at least 50µV peak-to-peak) were included, whereas latency maps and CoGs were calculated from the latencies at and below the individual shortest latency + 3ms (corresponding to two typical I-wave cycles of 1.5 ms [34]).
Statistical Analysis
A linear mixed model was used to assess the influence of the MEP parameter (amplitude/latency), hemisphere (left/ right) and muscle-of-interest (FDI/APB/ADM) on the representation area and CoG. Furthermore, paired samples t-test was used to evaluate inter-hemispheric differences in rMT, latency, area (amplitude and latency) and the ratio of the latency area to the amplitude area in the FDI muscle. The correlation between rMT and ratio of latency area to amplitude area was assessed with Pearson’s linear correlation. Statistical analyses were conducted in SPSS Statistics 22.0 (IBM Corporation, Somers, NY) using Sidak post-hoc test, when necessary.
RESULTS
The distribution of the MEP latencies for FDI is presented in Fig. (2) (pooled data from both hemispheres). The majority of the latencies had an approximate delay of 3 to 6 ms from the shortest latency. The shortest latencies were located in the centre of the latency maps, whereas the longest latencies were associated with the edges of the latency maps (Fig. 3). In a few maps, separate distinct centers of short latencies could be observed (Fig. 4). The individual and group characteristics of latencies and amplitudes of FDI muscle, as well as the inter-hemispheric differences evaluated with a paired t-test, are shown in Table 1.
According to the linear mixed model, the area of the latency map was significantly influenced by the hemisphere (F=5.56, p=0.022), the representation area was larger in the dominant left hemisphere (Fig. 5) as was the case also with the amplitude map (F=9.57, p=0.003). rMT exhibited an inter-hemispheric difference (F=6.43, p=0.032, Table 1) in this study population, but neither the latency area (r=0.199, p=0.401), the amplitude area (r=0.315, p=0.175) nor the ratio of the latency area to the amplitude area correlated with rMT (r=-0.180, p=0.446). The ratio of the latency area to the amplitude area displayed no inter-hemispheric differences (p=0.665).
No statistically significant differences were observed between latency and amplitude CoGs (medial-lateral F=0.09, p=0.760; anterior-posterior F=0.191, p=0.663) (Table 2, Fig. 5). Instead, the latency and amplitude CoGs were more lateral (F=20.07, p<0.001) and more anterior (F=6.29 p=0.014) in the non-dominant right hemisphere (Table 2).
The muscle-of-interest did not influence the area of the latency map (F=2.31, p=0.111). Further, no between-muscle differences were observed in latency or amplitude CoGs in the medial-lateral direction (F=2.29, p=0.107) or in the anterior-posterior direction (F=1.85, p=0.163). The intersubject variability as assessed by the standard deviations in CoGs was smallest in the medial-lateral direction in all of the evaluated muscles (Table 2).
DISCUSSION
In this study, nTMS mapping of cortical muscle representations for small hand-muscles was performed by analyzing MEP latency information in addition to the determination of amplitude. The latency and amplitude CoGs were congruent as expected and in accordance with earlier observations [10]. Both CoGs were located in the primary motor cortex. The shortest latencies were detected in the middle of the map whereas MEPs with longer latencies were distributed in the borders of the representation area. This held true not only in the medial-lateral direction, as in an earlier non-navigated TMS study [24], but also in the anterior-posterior direction (Fig. 3).
The motor representations areas, determined either with MEP latency or amplitude, were significantly larger in the left (dominant) hemisphere, especially in the medio-lateral dimension, in agreement with previous findings [10, 35]. The representation areas did not correlate with rMT, indicating that the map areas were independent of individual cortical excitability. Furthermore, the ratio of the latency area to the amplitude area exhibited no inter-hemispheric differences. The CoGs were more lateral and more anterior in the non-dominant right hemisphere, which may indicate that there is a different topographical organization of motor representation in the dominant hemisphere in comparison with its non-dominant counterpart caused by the asymmetrical usage of hands.
The variability in MEP latency at different scalp locations may reflect the number of evoked I-waves, i.e. the MEPs with shortest latency are likely induced either by D-waves or the first I-waves [25]. The latency histogram of the present study showed a slightly unbalanced distribution with a tail towards longer latencies. The descending neuronal pathways with the longest latencies are probably polysynaptic. Since the latency map was defined being the shortest latency + 3 ms, the latency representation was smaller than the corresponding amplitude representation containing all the accepted MEPs. The 3 ms limit was estimated based on the duration of two typical I-wave cycles [36, 37], and this was considered to be relevant when creating the latency maps. It is probable that the shortest latencies can be considered to indicate the direct, monosynaptic motor pathways. The latency maps were often scattered and in some subjects, several separate centres could be identified (Fig. 4). There is previous evidence of distinct non-primary motor areas reactive to TMS and with MEP latencies with the same or even faster delays [14].
A considerable limitation in our study is that the shortest latency was assessed from MEP mapping performed during muscle relaxation rather than with concurrent voluntary muscle contraction. Muscle contraction (both ipsilateral and contralateral) decreases the threshold for neuronal excitation and this is known to shorten the MEP latency, potentially as a result of recruitment of motor units with higher excitation thresholds as well as the multiple firing of some motor units [38-40]. Further, the mapping was conducted with only slightly suprathreshold stimulation intensity (110% of rMT) and a higher intensity would have been needed to shorten the latency. Therefore, the true minimum latency of the MEP may not have been achieved and this might have led to the larger between-subject variations in the observed motor map. With surface EMG, however, the D- and I-waves cannot be detected and this can only be speculated.
No evidence of organization according to somatotopy in the medio-lateral direction previously observed [41] between the muscles was observed in the CoGs. However, since only a few hand muscles were studied, it is not possible to speculate further on any somatotopical organization. In addition, the muscle representations are known to largely overlap in the cortex [41, 42] and the spatial resolution of nTMS is also indicated to differ according to which muscle group is mapped [43]. Since the MEP amplitude and latency CoGs did not differ, the latency CoGs are expected to be well repeatable similarly to amplitude CoGs [9].
The combination of latency information with that of amplitude could supplement the spatial distribution data about the motor representation; it could possibly achieve an improved outcome, e.g. by revealing the most essentially involved cortical area in the pre-surgical evaluation of tumor resections. The latency maps with the shortest latencies could also be used as a seed for tract-based spatial statistics analysis to ease the tracking of the corticospinal pathways [44]. Furthermore, long latencies might be indicative of pathways under stress in certain clinical situations such as may occur when a tumor is compressing the tract. Clearly this hypothesis can only be examined in detail by investigating patient data, which is on the way.
CONCLUSION
In conclusion, we found that, in addition to MEP amplitudes, the MEP latencies could also be used for outlining and locating muscle representation areas in the motor cortex during a motor mapping procedure with nTMS. The advantages of using MEP latencies are that they are a more stable response and they have the potential ability to detect stressed or the most direct connections in the motor tract, possibly providing information originating from the subcortical level. The potential of latency mapping, however, still needs to be validated with further studies with tumor patients.
LIST OF ABBREVIATIONS
CONFLICTS OF INTEREST
Petro Julkunen has received consulting fees from Nexstim Plc, the manufacturer of navigated TMS systems, unrelated to this study.
ACKNOWLEDGEMENTS
The authors acknowledge the Research Committee of the Kuopio University Hospital Catchment Area for the State Research Funding (project 5041730, Kuopio, Finland). This study was also funded by The Finnish Concordia Fund, Helsinki, Finland, The Finnish Brain Research and Rehabi-litation Center Neuron, Kuopio, The Paulo Foundation, Helsinki, Finland, and Foundation for Aalto University Science and Technology, Espoo, Finland. The funders had no further role in study design or in the collection, analysis and interpretation of data, in the writing; or in the decision to submit the paper for publication. Furthermore, the authors acknowledge Ewen MacDonald PhD for language revision.