All published articles of this journal are available on ScienceDirect.

Neurological Assessment Scores in Rabbit Embolic Stroke Models
Authors Info & Affiliations
Abstract
Background:
Neurological outcomes and behavioral assessments are widely used in animal models of stroke, but assessments in rabbit models are not fully validated. The wryneck model of neurological assessment scores (NAS) was compared to percent infarct volume (%IV) values (infarct volume is a proven clinical indicator of stroke severity) and arterial occlusion localization in three rabbit angiographic stroke models.
Hypothesis:
NAS values will correlate with percent infarct volume values.
Methods:
Anesthetized New Zealand White rabbits (N=131, 4-5 kg) received internal carotid artery emboli by angiographic catheter introduced into the femoral artery and occlusions were characterized. Rabbits were evaluated at 24 hours post embolism using the NAS test of 0 (normal) to 10 (death). Deficit criteria included neck twist, righting reflex, extension reflex in hind paw and forepaw, and posture. Brain sections stained with triphenyltetrazolium chloride (TTC) were analyzed for %IV. Volume of the infarct was measured and calculated as a percent of the total brain volume.
Results:
The aggregate correlation for NAS values vs. %IV values was R=0.61, p<0.0001, a strong positive relationship, while correlations of the NAS components ranged from R=0.28-0.46. Occlusionsof the posterior cerebral artery vs. the middle cerebral artery alone produced significantly greater deficit scores at p<0.0001.
Conclusions:
These positive results validate the NAS system in the rabbit angiographic embolic stroke model.
INTRODUCTION
Appropriate animal models play critical roles in the development of new treatment strategies for acute stroke, and many have proven successful [1]. Zivin’srabbit model of ischemic stroke in 1985 was crucial to development of successful human tPA stroke therapy [2,3]. Behavioral scores based on assessment of the deficits induced by stroke in animal models are reported in the majority of studies. These scores range from simple (1 or 0 score for deficits present or absent) to more complex (41 point scale). In the most commonly used stroke model, occlusion of the middle cerebral artery of the rat, either transient or permanent, the most frequent battery of behavioral tests had scales of 5, 12, or 18 points [4-6]. These most frequently include paw placing, reflex changes, posture maintenance, circling, paw extension in response to being pushed toward the body, and spontaneous walking. In some scales death is given the maximum score. Similar neurological tests are used to evaluate stroke models in mice, rabbits, and non-human primates. In the rabbit,behavioral scores range from the binary score of 0 or 1 [2] to the more detailed score 0-11 of Zhao [7]. More detailed scores were used inthe photochemical occlusion of the middle cerebral artery method of producing a stroke [7,8]. In those two studies significant differences were found between behavioral scores after experimental treatments compared to non-treated controls. In the present report three previously published methods of producing an embolic stroke in rabbits [9], and the system used to score those animal behaviors for moderate to severe stroke is further evaluated. This review of that scoring system in three different types of embolic stroked non-lytic rabbit groups is necessary to provide proof of the scoring concept for each system’s stroke severity and its accompanying neurological deficits. Resulting deficits were evaluated by a scale similar to the 10 point scale of Kawano et al. [8] in his photochemically induced stroke model and herein called the NAS scale. The NAS scale (or the Wryneck evaluation) has the ability to detect neurological impairment without the prior stimulus training often necessary in rodent models. Our rabbit embolic stroke models using soluble and insoluble emboli produce distinct focal patterns of predominately middle cerebral artery (MCA) ischemic injury. These clinically relevant models mimic situations of soluble and insoluble emboli in humans [9]. We deliver fresh clot [10], aged clot [11], or microsphere emboli [12,13], angiographically into the internal carotid artery (ICA) to cause acute ischemic strokes of moderate severity. Since deaths and inappropriate arterial occlusions are low (≤14%) [9], a comprehensive neurological outcome scale to assess severityof injury was chosen [14]. We investigated whether defined occlusions, vital stains, and histopathologic volume measurements of infarct at 24 hours correlated with neurological outcome assessments.
MATERIALS AND METHODOLOGY
Animals
The University of Arkansas for Medical Sciences Institutional Animal Care and Use Committee approved this study. Our animal facility is AAALAC accredited. New Zealand white rabbit results (N=131; 4-5 kg) were consolidated from several control groups in randomized controlled studies using one of three cerebral embolic models: 1) soluble fresh clot emboli (n=54) [15], 2) aged clot(n=37) [11], or 3) insoluble microsphere emboli (n=40) [12,13].
Cerebral Embolic Model
Angiographic procedures were described previously [9-5]. Briefly, rabbits were anesthetized, had angiography and embolization accomplished by injecting soluble clot emboli (fresh, 1.6x 0.6mm, or aged, 4.0 x 1.2 mm) cylindrical clot, or insoluble emboli (700-900 µm microspheres) with 0.7 to 2.0 mL of saline. Repeat angiography 1 minute later documented occlusion (Fig. 1). Neurological deficits were assessed 24 hours later.
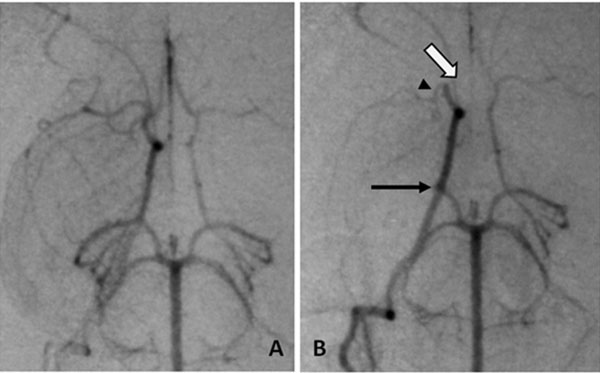
Angiography of occlusion, A, normal anatomy of the Circle of Willis, B, emboli in the three usual branches, arrows (open) ACA, (head) MCA and (closed) PCA.
Functional Testing
Each rabbit received NAS testing at 24 hours allowing adequate anesthesia recovery and clearly defined infarcts (Table 1). The animal was placed on a smooth rubber mat on the floorand potential torsion of the neck was evaluated. Behavior was scored as a 0 for normal position and use of neck, 1 if neck was twisted to the side, indicating a wryneck. For the righting reflex the animal was placed on its back and scored 0 if righted within 1 second, 1 if righted within 1-5 seconds and 2 if righting required more than 5 seconds. In testing paw dysfunction (re-extension), the paw was pulled toward the body and the time for extension of the paw was measured. Zero indicated re-extension of the forepaw within 1 second, 1 if re-extension occurred in 1-5 seconds and 2 if more than 5 seconds were required. This test was repeated for the hindlimbs and the same score was given. In the postural reflex test, maintaining normal posture, 1 was scored if there was reduced resistance to lateral push, or 2 if the animal fell down on the contralateral side. If the animal was dead a score of 10 was given. The maximum score for the exam was 10.
Neurological Assessment Score (NAS) Method
| Test | Clinical Criteria | Score | Potential Score | Correlative R Values to %IV |
|---|---|---|---|---|
| Behavior | Neck Twist | 0-normal, 1-twist of the neck | 1 | .396 |
| Reflex | Righting Reflex | 0-right in 1 sec, 1-right in 5 sec, 2-not right in 5 sec | 2 | .458 |
| Stimuli Reflex | Extension Reflex (forepaws)a | 0-right in 1 sec, 1-right in 5 sec, 2-not right in 5 sec | 2 | .368 |
| Stimuli Reflex | Extension Reflex (hindpaws)a | 0- right in 1 sec, 1-right in 5 sec, 2-not right in 5 sec | 2 | .278 |
| Posture | Posture | 0-normal resistance to contralateral push, 1-reduced resistance to lateral push, 2-falls down on contralateral side | 2 | .337 |
| Death | Maximum Score with death | 10 | -- | |
| Total Cumulative Score Possible | 10 | |||
a The paws are gently pulled toward the body, the time to re-extend the paw is scored
Percent Infarct Volume
Rabbits were euthanized with pentobarbital i.v. Brains were sliced at 4.0 mm intervals and vital stains performed with 1% 2,3,5-triphenyltetrazolium chloride (TTC) followed by formalin fixation and standard histology. Areas of infarction were measured using the NIH ImageJ program 1.44p on digital photographs. Images were measured by blinded individuals. Percent infarct volume (%IV) was calculated as a percent of total measured brain volume.
Statistical Analysis
For each group %IV is reported as mean±SE. Percent infarct volume was compared using ANOVA and mean NAS values are reported for each group and compared (Scheffe’s method). Pearson’s correlation was used to evaluate the association between %IV and 1) NAS values of embolic models and 2) individual criteria, aggregate NAS values, and the arterial occlusion pattern.
RESULTS
NAS Values for Stroke Models
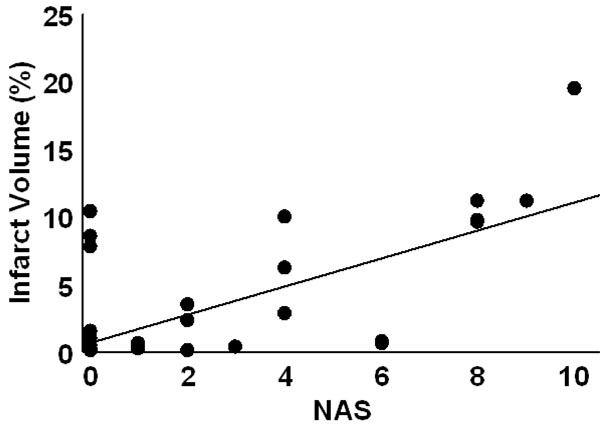
At 24 hr post-embolism mean NAS values were 1.7±0.3 (fresh clot), 2.4±0.5 (aged clot), and 3.6±0.5 (microsphere emboli) and were compared (ANOVA p=0.007). Post hoc, the fresh clot model was different from themicrosphere model (p=0.0018) but neither fresh clot nor microsphere groups were different from the aged clot model. Infarct percent volumes were 0.6±0.2%, 3.3±0.8%, and 5.3±1.2, respectively. A comparison of all NAS values (from each of the three stroke models) vs. %IV values indicates a strong positive relationship (R=0.61, p<0.0001). NAS values resulting from strokes produced in the three individual models correlated with %IV values as follows: fresh clot R=0.501 (Fig. 2), aged clot R=0.654 (Fig. 3), and for microspheres R=0.615 (Fig. 4). Correlations of individual test components to %IV are listed in Table 1.

Infarct volume as a function of NAS score for fresh clot induced stroke. The smaller %IVs in this model do not correlate as well (R=0.501) with NAS values as do the other embolic models.
Infarct volume as a function of NAS score for aged clot induced stroke. Although these anterior infarcts are sometimes clinically silent, they are larger than seen in the fresh clot models. The regression line had an R = 0.654.
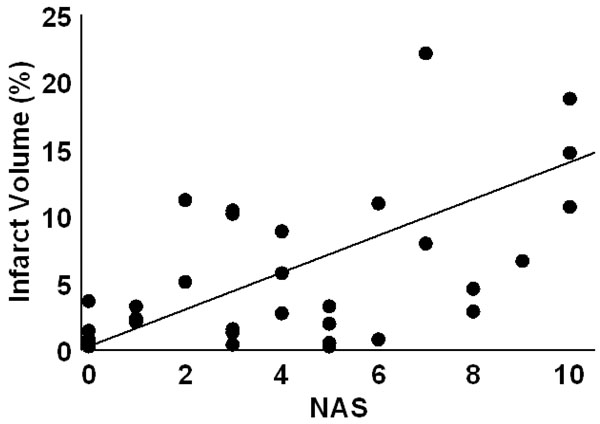
Infarct volume as a function of NAS score for insoluble microsphere induced stroke. The regression line had an R = 0.615.
Angiography and Occlusion Sites
Angiography showed occlusions in three combinations: 1) middle cerebral artery (MCA), 2) middle + anterior cerebral arteries (MCA+ACA), and 3) MCA+ACA plus one vessel in the posterior arterial circulation (PAC)(Fig. 1). Cases receiving emboli but showing ‘no apparent’ angiographic occlusions were designated as “NA”. NAS values for the three occluded vessel combinations were MCA=2.0±0.3, MCA+ACA=3.0±0.5, MCA+ACA+PAC=7.3±1.4 and NA= 1.7±0.4, p<0.0001. See Table 2 for distribution. Compiling all models, the largest %IV was in MCA+ACA+PAC (14.1± 2.1%) followed by MCA+ACA, MCA and NA (4.4±1.1%, 1.6±0.4% and 0.61±0.2%, respectively).
Angiography Results for Observed Frequencies for Emboli Model and Occlusion Location
| Observation and Number of Occlusionsa | |||||
|---|---|---|---|---|---|
| Embolic Model | NA (%) | MCA (%) | MCA+ACA (%) | PC (%) | Totals |
| Fresh Clot | 23 (42.6) | 29 (53.7) | 2 (3.7) | 0 (0) | 54 |
| Aged Clot | 1 (2.7) | 21 (56.7) | 14 (37.8) | 1 (2.7) | 37 |
| Microspheres | 1 (2.5) | 15 (37.5) | 18 (45) | 6 (15) | 40 |
| Totals | 25 (19.1) | 65 (49.6) | 34 (26) | 7 (5.3) | 131 |
a Occlusions were noted 1 min following embolization.
DISCUSSION
At 24hr after stroke the neurological assessment score (NAS) for all three embolic models significantly correlated with the percent infarct volume(R=0.61, p<0.0001), thus, this behavior assessment can be used as an indicator of the magnitude of neurologic deficits for rabbit embolic stroke models (Table 1). End points in animal models of stroke have included infarct volumes, imaging, blood tests, neurologic deficits, pathological examination, behavior changes and various others, individually or in combination. Almost 15 years ago extensive behavioral evaluations including preconditioning behaviors were recommended for rodents and gerbils along with longer delays before final testing [16-18]. However, even with these evaluations, translation of successful models in small animals to human use often fails [19]. Larger animals, especially rabbits [10] have provided some success, even with very simple behavioral evaluations, perhaps due to issues of brain size, metabolic rate, and ratio of white to gray matter [20].
In our studies, comparison of these three embolic stroke models (fresh clot, aged clot and microsphere) shows corresponding and parallel increases in NAS values and %IV values (Table 2 and Figs. 2-4). Recanalization may be a key factor here. Autolysis of soft fresh clot causing restoration of blood flow is common in our rabbit embolic stroke model while firmer aged clots are resistant to autolysis, and embolic microspheres cause permanent occlusions with no possible autolysis. The fresh clot model usually demonstrates silent anterior infarcts and sparing of the posterior circulation, thereby, causing lower NAS values and lower correlation with the %IV.
In addition, %IV increases with the number of major cerebral vessels occluded and decreases with less effective embolic agents, with corresponding changes in the NAS values in each case. With more vessel occlusions the effective collateral blood flow supporting the penumbra decreases. This may account for larger infarcts and higher NAS and %IV values. The flow directed nature of the angiographic model usually leads to occlusion of the MCA first, the ACA second, with posterior vessels (the posterior cerebral and superior cerebellar arteries) occluding later if more emboli or fragments are involved. Occlusion of the anterior vessels is relatively silent with more dramatic clinical signs associated with the posterior circulation [14]. The NAS confirms this pattern.
Thus, the NAS is a step towards a more complete behavioral characterization for rabbit models of stroke and has now been validated in our three embolic stroke models and by similar assessments in several other different rabbit stroke models. Recent reports confirm the important correlation of acute infarct volume and eventual clinical outcomes in human stroke [20, 21]. This reinforces the value of infarct volumes in all stroke assessments. The strong correlation of overall NAS values with %IV in this study validates the use of the NAS examination in rabbit stroke models, providing an additional indicator of severity without sacrificing the animal or the additive expense of MRI examinations.
CONCLUSION
In summary, the NAS method provides a valid neurologic assessment of ischemic brain infarcts in rabbits. The strong correlation of overall NAS values and the results with %IV in each of our three embolic stroke models here validates the use of NAS in rabbit stroke models without pre-conditioning, sacrificing the animal, or the expense of MRI examinations of the brain.
CONFLICT OF INTEREST:
None
ABBREVIATIONS
ACKNOWLEDGEMENTS
Sources of funding: NIH grant RO1 HL082481 and UAMS grant Hornick Endowment for Research into Stroke and Related Disorders 2011-2013 to W.C. Culp and UAMS College of Medicine Bridging Grant