All published articles of this journal are available on ScienceDirect.

Width of 3. Ventricle: Reference Values and Clinical Relevance in a Cohort of Patients with Relapsing Remitting Multiple Sclerosis
Authors Info & Affiliations
Abstract
Objectives:
To estimate the quantity of multiple sclerosis (MS) patients with brain atrophy as indicated by third ventricular enlargement using transcranial colourcoded ultrasound (TCCS).
Methods:
The width of the 3. ventricle was assessed by TCCS in 70 healthy controls (male 31, female 39, mean age 41 ± 15 years, age range 18 – 79 years), and in a cohort of 54 patients with relapsing remitting MS (male 16, female 38, mean age 40 ± 10 years, median EDSS 2 [1-3]).
Results:
In the controls, the width of the 3. ventricle increased with age (without any sex differences) from 3.0 ± 0.76 mm in the age group < 40 years to 4.0 ± 0.74 mm in the age group of 60 years or more (ANOVA p=0.0001). Derived from regression analysis, the upper limit of the 95% Confidence Interval for each year provided cutoff points according to which 14 of 54 patients (25%) exhibited an enlarged 3. ventricle. In a multivariate regression analysis, the width of the 3. ventricle over all MS patients was significantly related to EDSS (Spearman rho , r=0.446, p<0.005) and to MS duration (r=0.319, p<0.005).
Conclusions:
Even in MS patients in good clinical conditions the rate of patients with brain atrophy determined by TCCS is high.
INTRODUCTION
Over the last decade brain atrophy in patients with multiple sclerosis (MS) has found increasing interest. The body of magnet resonance imaging (MRI) derived evidence is growing that brain atrophic processes are highly frequent in MS patients, that brain atrophy varies regionally in the different parts of the brain, and that it involves the cortical grey matter as well as the basal ganglia, and to a lesser amount the white matter [1-7]. The clinical presentation of MS patients seems to be explained more accurately with the disease burden in the grey matter and the basal ganglia as compared to lesions in the white matter [4,6,8,9]. Brain atrophy, either globally or regionally, may serve as a gross marker of all pathological processes.
With increasing interest in brain parenchym sonography by means of transcranial colourcoded duplex sonography (TCCS), there are a few report over the last years showing close correlations between TCCS and cranial computed tomography or MRI in assessing the ventricular system, e.g. the widths of the 3. ventricle or of the frontal horn of the lateral ventricles [10-13]. The ultrasound marker of brain atrophy is an enlargement of the 3. ventricle and/or the frontal horns. In a few studies in MS patients [11,12,14] there was a significant positive correlation between an increasing width of the 3. ventricle and the clinical status as indicated by the Expanded Disability Status Scale (EDSS) [15]; such a relationship to the width of the lateral horn was much weaker. Three recent MRI studies [5,9,16] suggested that brain atrophy may differ depending on the kind of disease modifying therapy (DMT). Our study aimed to provide normal data to allow an assessment of the width of the 3. Ventricle in patients with MS, to estimate the prevalence of brain atrophy (as indicated by third ventricular enlargement) in a group of MS patients, and to look whether different DMT medications may affect brain atrophy as determined by TCCS.
MATERIALS AND METHODOLOGY
The study was approved by the local ethics committee, and all participants gave their informed consent.
Ultrasound Investigations
All TCCS investigations were performed with a high end ultrasound device Acuson Antares (Sonoline) with a color coded 1-4 MHz phased array transducer. The 3. ventricle was visualized through the preauricular temporal acoustic window at an axial image plane; it is identified as an an-/hypoechogenic space with hyperechogenic horizontal boundary lines (corresponding to the ventricle walls) lying in front of the pineal gland and between the basal ganglia structures (Fig. 1). The width of the 3. ventricle was assessed as the maximum distance between the inner boundaries of both hyperechogenic lines after they were displayed strictly parallel.
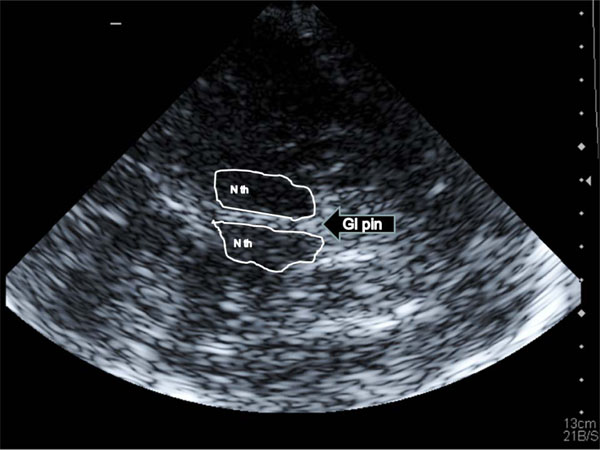
A Transtemporal insonation of the third ventricle: landmark structures are both thalamic nuclei (N th) and the pineal gland (Gl pin); the third ventricle is located between the thalami and indicated by the two hyperechogenic lines.
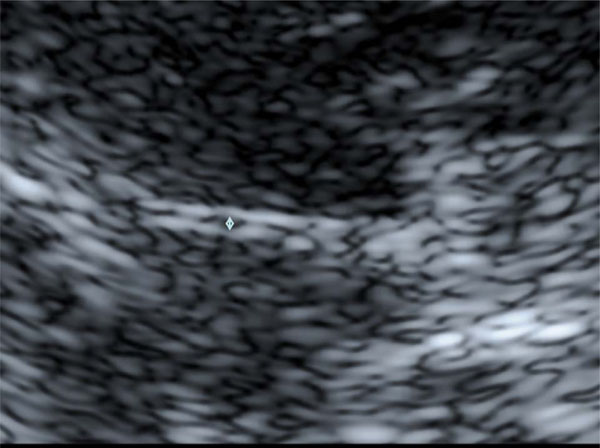
B Enlargement of Fig. (1) A The width of the third ventricle is measured as the distance between the inner bounds of the bright ventricle walls (↕).
After a training period, two experienced TCCS examiner (M.M., J.V.) performed an interobserver study in 20 randomly selected persons (male 13, female 7; mean age, 41 ± 18 years). Each examiner performed the TCCS investigation independently from the other. The insonation of the 3. Ventricle was performed from both sides of the head, and each run consisted of three measurements (with removal of the insonation probe from the skull inbetween) from which a mean for each side was calculated. The definite individual width of the 3. ventricle was the mean of the mean of both sides. The coefficient of determination (R2 statistics) between both examiners to assess third ventricular width was R2 = 0.97. Using Bland-and-Altman-Plot [17] (Fig. 2) statistics, the mean of the interobserver difference was 0.24 mm with the 1.96 SD boundaries at 1.06 mm and -0.56 mm. The two outliners (1.15 mm, -0.8 mm) were recorded in two persons with poor insonation conditions, but both were still within an acceptable deviation range of about one mm. All TCCS examinations were performed by M.M. or J.V.
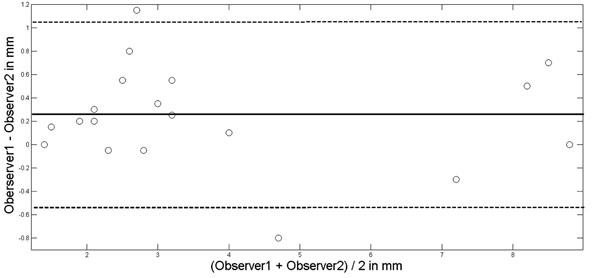
Bland-Altman-Plot for interobserver agreement in assessing the width of the third ventricle. Mean of observer difference solid line; mean ± 1.96xSD (standard deviation) dotted lines.
Control Subjects
Seventy healthy subjects (male 31, female 39, mean age 41 ± 15 years, age range 18 – 79 years) without any diseases of the central nervous system or vascular risk factors served as controls. 36 were <40 years of age, 24 between 40 and 59 years, and 10 60 years or older. Between both gender there was no age difference. In each subjects atherosclerotic carotid artery disease was excluded by means of carotid Duplex ultrasound using the same equipment but a 4-10 MHz linear array transducer.
PATIENTS
From our outpatient facility, we recruited 54 patients with definite relapsing remitting multiple sclerosis using the 2005 revised McDonald criteria [18]. All patients were without secondary progression (male 16, female 38, mean age 40 ± 10 years) and under DMT with either interferon INF-beta-1b sc (n=22), INF-beta-1a sc (n=19), INF-beta-1a im (n=12) or glatiramer acetate (GM; n=1). No patient was previously treated with other medications than these DMT drugs. All but one patient had started their disease modifying therapy at the time of their definite MS diagnosis. The one patient was diagnosed in 1986 and started the medication in 1995 after a new relapse. Patients having changed the DMT during the disease course, had to have the actual medication for at least 2 years to become classified into one of the medication group, otherwise the patients were not included into the study. Patients with a disease duration of 2 years or less all had remained on the same medication. Thus, our patients represent a selected group of clinically relatively stable MS patients.
The clinical examinations were performed by two neurologists (K.K., P.S) who were unaware of the TCCS results and who classified their clinical findings according to EDSS. The EDSS evaluation was not performed when a relapse was actually present. The duration of MS disease was determined from the time point of the definite MS diagnosis until study inclusion. The clinical and TCCS examinations were performed usually on the same day.
Statistical Analysis
Data are reported in mean ± standard deviation (SD) apart from EDSS which is reported in median and percentiles (25. and 75.). To compare means t-test was used for comparisons between control and patient groups; to compare means or medians within the group of controls or patients one sided ANOVA or Kruskal-Wallis procedure was used. For correlation analysis Spearman’s rho (r) was used. For all analysis Matlab (Release R2011a, The MathWorks, Inc., Natick, MA, USA) was used. A p-value of <0.05 was considered significant
RESULTS
In all controls and in all patients the insonation conditions were good allowing a clear identification of the 3. ventricle.
Controls
Without any sex differences the width of the 3. ventricle increased with age from 3.0 ± 0.76 mm in the age group < 40 years to 4.0 ± 0.74 mm in the age group of 60 years or more (ANOVA p<0.0001; Table 1). Fig. 3 shows the relation between age and third ventricular width (r = 0.488, p=0.0001) and provides the upper and lower 95% confidence intervals.
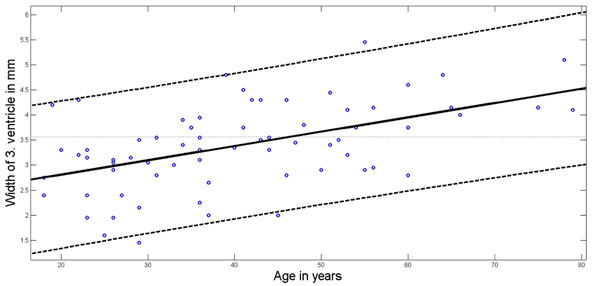
Age dependency of 3. ventricular width. Regression line (solid line) according to least squares method; 95% Confidence Interval boundaries in dotted lines.
Age and Sex Related Width of the 3. Ventricle in the Control Subjects
ANOVA: p=0.0001 over all age groups.
* significant different from age group <40 years.
All values in mean ± SD.
Patients
EDSS in the patient group was 2 (1-3) with a total range between 0 and 6. Mean MS duration was 6 ± 5 years. Mean third ventricular width of all MS patients (3.9 ± 1.6 mm) was significantly (p<0.001) larger as compared to the controls (3.4 ± 0.83 mm). Using at each patients age the upper line of the 95% confidence interval to define whether the ventricular width is within normal rage or enlarged, 14 of the 54 patients exhibited an enlarged third ventricular width (25%). In the remainder of patients with third ventricle width within the normal range, the mean width was 3.3 ± 1.2 mm. There was no difference regarding age and MS duration between the patients with ventricular enlargement and without; although not significant (p=0.12), patients with enlargement had had a higher EDSS [2.5 (1-3.5)] than the patients without [1.5 (1-2.5)].
In an univariate analysis, the width of the 3. ventricle over all MS patients was significantly related to EDSS (r=0.446, p<0.0001) and to MS duration (r=0.319, p=0.01)) and age (r=0.426, p<0.0001); using a stepwise regression model with EDSS, MS duration and age as input variables and the width of the 3. ventricle as output variable, MS duration (p=0.002) and EDSS (p=0.004) remained significantly related while age didn’t.
Patient’s actual medication did not have an influence on 3. ventricular width or on the frequency of ventricular enlargement in the different treatment groups (Table 2).
Patient Characteristics According to their Medication
| Medication group | Mean Age | EDSS | MS Duration | 3v Width | 3v ↑ |
|---|---|---|---|---|---|
| INF-beta-1b sc (n=22) | 42 ± 10 | 1.5 (1-3) | 4.8 ± 4 | 3.8 ± 1.4 | 4 |
| INF-beta-1a sc (n=19) | 38 ± 9 | 2.0 (1.5-3.5) | 6.9 ± 7 | 3.8 ± 2.0 | 6 |
| INF-beta-1a im (n=12) | 43 ± 11 | 1.5 (1-2.5) | 6.0 ± 6 | 4.2 ± 1.3 | 4 |
| p | n.s. | n.s. | n.s. | n.s. | n.s. |
Age in years; MS (multiple sclerosis) duration in years; 3v width, width of 3. ventricle in mm; 3v ↑, number of patient with third ventricular enlargement as indicated by being above the upper limit of the 95% confidence interval of the control population.
All values in mean ± SD apart from EDSS which is presented in median and percentiles (25. and 75.). n.s., not significant.
DISCUSSION
The width of the third ventricle has now been assessed by several groups. The mean widths vary between 3.6 ±1.8 mm [19] and 6.2 ±1.9 mm [10] with several studies in between (3.9 ± 2.5 mm [13], 4.5 ± 1 mm (Berg et al [11], derived from figure 1). The values of Seidel et al [10] were published in 1995, hence the data were collected one or two years earlier which could implicate that the then older technologic equipment might be one reason for their results. We performed our study using nearly the same technique and nearly the same equipment as Wollenweber et al. [19] and achieved quite close results.
To define the normal range of the third ventricular width we used the upper line of the 95% Confidence Interval which provides a definite width for each year. If we had used instead the mean width plus the 2 SD, the upper limit over the whole age range would have been 5.06 mm; using this cutoff point to define normal from enlarged the rate of ventricular enlargement would be 11/54 = 20% (instead of 14/54 = 25%). Depending on the method, a fourth of enlarged ventricles would have been missed.
Over all our patients, the third ventricle was larger as compared to the ventricular width of the controls. Our mean width in the patients was 3.8 mm, that in the patients reported by Schminke et al [14] 4 mm, and that reported by Berg et al [11] 7.2 mm. The patient’s characteristics of the Schminke group was similar to ours with a median EDSS of 2 and a mean disease duration of 6 years. In the Berg group the median EDSS was 5.5 and the mean duration of the disease was 9.4 years. Neither in the Schminke group nor in our group patients with secondary progressive MS were included; this MS subpopulation, however, accounted for 45% of the Berg group. From MRI studies it is reported that especially the patients with secondary progressive MS exhibit a pronounced increase of the ventricular system as an index of whole brain atrophy [20].
Regarding brain atrophy in the DMT treatment groups we were not able to detect differences between the groups. In contrast to MRI, which could demonstrate such differences; this, however, occurred predominantly in the cortical grey matter [5,9,16], an area which is not reliably insonatable by TCCS. Despite TCCS’s disadvantage to be less able to differentiate regional differences of brain atrophy, the clinical relevance of third ventricular width as an index of brain atrophy seems comparable to MRI derived atrophic indexes when the Spearman correlation coefficients are compared. We found a rho coefficient of 0.44 between EDSS and third ventricular width which is close to the to the results of Schminke et al [14] and Berg et al [11] who reported both a rho correlation coefficient of 0.4. According to MRI investigations brain atrophy is present in over 90% of MS patients [2]. However, even with such a high resolution method the correlation between brain atrophy and clinical findings is weak to moderate (Spearman rho-values between 0.29 and 0.6) [2,3,7,8]. Thus, from a clinical point of view the relationship between clinical presentation and brain atrophy can be evaluated similarly by TCCS and MRI. Even for longterm investigations TCCS may be useful; in two longitudinal TCCS studies a significant enlargement of the third ventricle was observed which was accompanied by a measurable clinical correlation [12, 19].
CONCLUSION
The assessment of the 3. ventricle by means of TCCS may provide information on the dynamics of brain parenchym changes in patients with MS. Even in MS patients in good clinical conditions the rate of patients with brain atrophy is high.
CONFLICT OF INTEREST
The author(s) confirm that this article content has no conflicts of interest.
ACKNOWLEDGEMENT
The study was sponsored in parts by Bayer (Schweiz) AG, Bayer Schering Pharma, Grubenstrasse 6, Postfach, CH-8045 Zürich, Switzerland.