Responses to Cortical Spreading Depression under Oxygen Deficiency
Abstract
Objectives:
Objectives: The effect of cortical spreading depression (CSD) on extracellular K+ concentrations ([K+]e), cerebral blood flow (CBF), mitochondrial NADH redox state and direct current (DC) potential was studied during normoxia and three pathological conditions: hypoxia, after NOS inhibition by L-NAME and partial ischemia.
Methods:
A special device (MPA) was used for monitoring CSD wave propagation, containing: mitochondrial NADH redox state and reflected light, by a fluorometry technique; DC potential by Ag/AgCl electrodes; CBF by laser Doppler flowmetry; and [K+]e by a mini-electrode.
Results and Discussion:
- CSD under the 3 pathological conditions caused an initial increase in NADH and a further decrease in CBF during the first phase of CSD, indicating an imbalance between oxygen supply and demand as a result of the increase in oxygen requirements.
- The hyperperfusion phase in CBF was significantly reduced during hypoxia and ischemia showing a further decline in oxygen supply during CSD.
- CSD wave duration increased during the pathological conditions, showing a disturbance in energy production.
- Extracellular K+ levels during CSD, increased to identical levels during normoxia and during the three pathological groups, indicating correspondingly increase in oxygen demand. 5. The special design of the MPA enabled identifying differences in the simultaneous responses of the measured parameters, which may indicate changes in the interrelation between oxygen demand, oxygen supply and oxygen balance during CSD propagation, under the conditions tested. 6. In conclusion, brain oxygenation was found to be a critical factor in the responses of the brain to CSD.
INTRODUCTION
Cortical spreading depression (CSD) is a transient neuronal depolarization that is accompanied by a negative shift in the DC potential and a flattening in EEG [1], changes in membrane permeability as well as in the ionic homeostasis [2], thereby increasing energy consumption [3] and blood flow [4, 5]. The activation of ion pumps, following the changes in extracellular and intracellular ion levels consumes energy [5, 6]. Therefore, the responses of the brain to CSD were used as a tool that increases oxygen demand [7] and serves as an indicator to the tissue energetic-metabolic state [7-9]. In the case of healthy normoxic brain, repeated CSD waves do not cause any damage to the tissue [10]. In contradiction, CSD is thought to be involved in the mechanism of the neurological symptoms in migraine with aura [4, 11] and it has also been reported that CSD may occur spontaneously under hypoxic or ischemic conditions [5, 11-13], following traumatic brain injury [2, 14, 15] and was also found to appear after epileptic seizures [11, 16].
The brain is completely dependent upon a continuous supply of blood flow providing oxygen, glucose, nutrients etc. Therefore, during pathological conditions, where oxygen supply is limited, such as hypoxia or ischemia, any increase in oxygen demand will cause an oxygen deficiency that will end with severe functional disorders and irreversible brain damage [17]. Under such conditions, CSD will increase tissue oxygen demand and lead to a further increase in oxygen deficiency [7, 18] which will augment tissue damage [12, 19, 20].
Nitric oxide (NO) acts as a neurotransmitter [21] as well as a regulator of cerebral blood flow [22, 23]. NO generation is closely linked with excessive glutamate release and has been implicated in ischemic and traumatic neurogeneration [22, 24]. However, a decline in CBF or in oxygen supply (i.e. under ischemia and hypoxia) was found to disturb NO production [25, 26]. Studies showed that the increase in CBF, during CSD after NO synthase inhibition, was diminished [27, 28]. In our previous studies we found that under normal oxygen supply, increasing oxygen demand by CSD induction, caused an increase in CBF in parallel to oxidation cycles in mitochondrial NADH [7, 8, 29]. We have also shown that responses (qualitative) to CSD during hypoxia and ischemia were controlled by the limited level of blood supply and low blood oxygen concentration. Under these conditions no oxidation waves were observed in NADH [7].
The aims of the present study were: 1. To find the interrelation between the changes in extracellular K+ (representing oxygen demand), CBF (representing oxygen supply) and mitochondrial NADH (representing oxygen balance) during CSD propagation, under hypoxia, ischemia and after NOS inhibition. 2. To examine the quantitative responses to CSD under hypoxia, ischemia, after NOS inhibition, compared to CSD under normoxic conditions.
MATERIALS AND METHODOLOGY
NADH Redox State Fluorometry
Mitochondrial NADH redox state levels can evaluate the oxygen balance in the monitored tissue [9]. NADH was monitored from the surface of the brain tissue as described previously [7-9]. The excitation light (366 nm) was passed from a fluorometer to the brain via a bundle of quartz optical fibers, and the emitted light (450 nm), together with the reflected light at the excitation wavelength (366 nm), were transferred to the fluorometer via another bundle of fibers. The changes in the reflected light were inversely correlated with changes in tissue blood volume and enabled the correction of hemodynamic artifacts that appear in the NADH measurement. It is also affected by movements of ions and water in the tissue [9, 30]. The changes in the fluorescence and reflectance signals during CSD propagation were calculated relative to the calibrated signals before CSD initiation.
Local Cerebral Blood Flow
Substrates and O2 are supplied by the blood in microcirculation, namely from the very small arterioles and the capillary bed. Therefore, changes in CBF levels were used to estimate oxygen supply [9]. CBF was measured in real time using the laser Doppler flowmetry (LDF) technique (Perimed, Sweden, PF315). The LDF results correlate well with other quantitative approaches to measure CBF [31].
Extracellular Potassium Concentration
The energy demand in the brain can be estimated by measuring the extracellular levels of K+ that reflect the activity of the major ATP consumer – NA+-K+- ATPase [9]. Extracellular levels of K+ were monitored by mini-electrodes (WPI, Sarasota, Florida, USA). The sensitivity of the electrodes to the specific ion is close to the Nernstian value, namely, 50-60 mV for K+. The mV output values of the electrode were transformed to mM values using the standard calibration technique and the principles of the Nernst equation.
Direct Current (DC) Steady Potential Electrode
The DC potential was measured by Ag/AgCl electrode (WPI, Sarasota, Florida, USA) relative to an Ag/AgCl reference electrode (equal in size to the DC steady potential electrode) that was implanted below the skin behind the ear.
Electrocorticography (ECoG)
Two platinum or silver rods inserted into the MPA system measured the spontaneous electrical activity from the surface of the cortex.
MONITORING SYSTEM
The Multiprobe Assembly (MPA) System
The MPA system is schematically illustrated in Fig. (1). It contains: 1) An optical fiber to monitor mitochondrial NADH redox state (surface fluorometry) and tissue absorption properties (reflected light); 2) Surface mini-electrodes for measuring extracellular K+ concentration ([K+]e) and DC steady potential; 3) A laser Doppler flowmeter to evaluate relative CBF; 4) Two platinum electrodes to detect spontaneous bipolar ECoG. The MPA measured the changes in the various detected parameters from the front line until the complete recovery period of CSD wave, continuously and simultaneously. The probes were embedded in a rectangular cannula and were arranged along a circumference of a circle. The KCl cannula (for CSD initiation) was implanted in the center of this circle, as illustrated in Fig. (1). All details regarding the MPA construction and calibration of the various probes were previously published [7, 8, 30]. In addition, the probes were arranged in the cannula according to the shape of the pre-determined CSD wave, allowing the CSD wave to be monitored from its front line until complete recovery, by all of the detected parameters. This enabled to evaluate and compare the order (in time) of amplitude changes (maximum, minimum) in the measured parameters according to the beginning of the CSD wave propagation. Thus, we were able to evaluate the interrelation between the measured parameters during the CSD wave propagation.
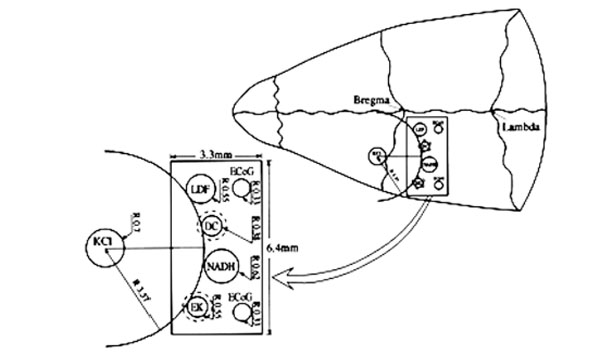
Schematic illustrations of the multiprobe assembly (MPA) system. Left side: The localization of the various sensors on the cortex. Right side: Location of the MPA on the rat cranium. LDF - light guide connected to the laser Doppler flowmeter; NADH - light guide connected to the fluorometer/reflectometer for NADH fluorescence and 366 nm reflectance; EK - selective K+ electrode; DC - direct current electrode; KCl - push-pull cannula for CSD initiation; ECoG - bipolar ECoG electrodes. R - radii of the circumference of the embedded probes.
GENERAL EXPERIMENTAL PROCEDURE
Animal Preparation
The Institutional Animal Care and Use Committee of Bar Ilan University approved all experimental protocols. Male Wistar rats weighing 200-250 g were anesthetized with a 0.3 ml/100g IP injection of Equithesin (each ml containing 42.51 mg chloral hydrate, 9.72 mg pentobarbital, 21.25 mg magnesium sulfate, 44.43% w/v propylene glycol, 11.5% alcohol and water). A thermistor probe (Yellow Springs Instruments Co. Inc., type 402, Ohio, USA) was inserted into the rectum to measure and control body temperature during surgery and experiment. The cranium was exposed and a thin rectangular Plexiglas pattern was located on it. The pattern contained two scratches: the MPA probe (6.4×3.3 mm) and the KCl push-pull cannula (2 mm diameter) in the exact shape as it is schematically illustrated in Fig. (1). Two holes were drilled: one in the frontal bone for the KCl cannula and the other in the ipsilateral parietal bone for the MPA implantation. No harm was done to the sagittal sinus during MPA implantation. The dura mater was gently removed only in the monitoring site and not where CSD was initiated. The push-pull cannula enabled flushing the brain with diluted KCl solution (0.5M) in order to induce CSD waves. If 0.5M did not induce CSD waves, then the concentration of KCl solution was increased to 1M up to saturated KCl solution (in increments of 0.5M) until the initiation of CSD waves. Two other holes were drilled for screws located in the contra lateral hemisphere that helped to securely hold the system to the cranium. All components were fixated to the skull using dental acrylic cement. About 15 minutes later, the animals were inhaled with pure N2 for about 20 seconds in order to check maximum NADH increase under anoxic conditions. This data was used to ensure no brain damage during the surgery procedure. The experiment started about 60-90 minutes after the surgery (after ensuring complete recovery from the surgery procedure). The animals were kept lightly anesthetized (leg reflex still remained and body temperature did not decrease under 36.5°C) by continuous IP infusion of 0.085-0.17 ml/h Equithesin (Eth.) depending on the rat's weight. This level of anesthesia also prevented spontaneous CSD waves. At the end of the experiment the animals were deeply reanesthetized and sacrificed by N2 inhalation. In the hypoxia group the femoral artery was cannulated and arterial blood samples were withdrawn for pH, pO2 and pCO2 analysis.
The decrease of oxygen delivery to the brain tissue was achieved by three different perturbations using three different animal protocols: hypoxia, partial ischemia and by inhibition of nitric oxide (NO) synthesis with Nω-nitro-L-arginine methyl ester (C7H15N5O4.HCl, L-NAME).
Hypoxia was induced by inhalation of a gas mixture containing 12% O2 + 88% N2 for 17-20 min. Partial ischemia was induced by permanent bilateral carotid artery occlusion 24 hours before monitoring.
Hypoxia Protocol
After recovery from the surgery procedure three CSD waves were induced with an interval of one hour between each wave. The first wave was induced under normoxic conditions (control); the second, under hypoxic conditions and the third under normoxic conditions. The CSD wave under hypoxic conditions was induced during gas mixture inhalation, when the parameters showed a new steady state (after about 6 minutes of inhalation). The hypoxic period continued for about 17-20 minutes until a recovery in CSD wave was achieved. The third CSD wave was induced one hour after the hypoxic CSD wave, under normoxic conditions, to verify recovery from hypoxia. This group contained 13 rats. This protocol contained 2 control groups: one group that passed the same protocol under normoxic conditions, without inducing hypoxia, (n=11) and another control group of rats that were inhaled with the gas mixture (in the same range of time) and no CSD waves were induced. This control group contained 8 rats and was done in order to ensure the effect of hypoxia on the measured parameters devoid of the effect of CSD propagation. Arterial blood samples were taken during normoxia and hypoxia.
Protocol of inhibition of Nitric Oxide Synthase (NOS)
Inhibition of nitric oxide synthesis (n=10) was achieved by IP injection of 50 mg/kg L-NAME solution. The protocol contained 3 CSD waves. The first CSD wave was induced under normoxia-control conditions. One hour later, 50 mg/kg of L-NAME was injected IP. Two additional CSD waves were induced one and two hours after L-NAME injection. The experiment and the monitoring period continued 1.5 hours after the last initiation of CSD wave. In another group of rats (n=11) 4 CSD waves were induced with an interval of one hour between each wave under normoxic conditions. This group of rats was considered as a control group for hypoxia and L-NAME groups.
Ischemia Protocol
Partial ischemia (n=9) was induced by permanent bilateral carotid artery occlusion. Twenty-four hours later the rats were reanesthetized and underwent preparation for the experiment and monitoring. Sham rats (n=8) underwent the same experimental procedure without carotids occlusion. CSD waves were induced (by epidural application of 0.5-2M KCl solution, using the lowest concentration that induced CSD), in lightly anesthetized rats in the partial ischemic and in sham rats.
Data Acquisition
The NADH fluorescence, reflected light, CBF, [K+]e and DC steady potential that were monitored by the MPA system were recorded continuously, simultaneously and in real time using Codas software for a 16-channel computerized acquisition and storage system (DATAQ Instruments, MN, USA).
Data Analysis and Calculation
Various time and amplitude values were calculated during the CSD wave cycles. In the present article we will present: The maximum (VTmax) and minimum (VTmin) amplitude values, as well as wave duration that were calculated for every parameter recorded by the MPA system. Wave duration was calculated as the time it took the CSD wave to propagate from the beginning of the changes in the measured parameters, (as a result of KCl application), until the wave's initial recovery.
Base line levels of reflectance, NADH and CBF were determined in steady state conditions prior to CSD wave initiation and were defined as 100%. The baseline DC potential levels were determined as Zero mV under the same conditions. Values at maximum - the maximum level of the increased amplitudes; Minimum - the minimum level of the decreased amplitudes (during CSD wave propagation) were calculated relative to their levels before the CSD episode. The mV output values of the ion selective K+ electrode were transformed to mM values to provide the [K+]e.
Statistical Analysis
Statistical analysis was performed by using the SPSS software version 15.0. Student’s paired and unpaired t-test was performed to evaluate the changes in amplitude values during CSD, between control and during the three pathological conditions tested. Results are presented as Mean ± SEM and a value of p<0.05 was considered significant.
RESULTS
The responses of the brain to induced CSD waves under different pathological conditions: hypoxia, inhibition of nitric oxide synthesis by L-NAME and ischemia, are presented hereby.
Hypoxia
1. Brain Responses to Hypoxia
Hypoxia increased significantly resting CBF (from 100.1±2.7% to 114.3±4.9%, p<0.01) and NADH fluorescence (from 99.8±0.8% to 114.3±1.8%). Furthermore, a significant decrease in the reflectance was seen (from 99.8±0.9 to 81.1±2.7, p<0.005) and no significant changes in [K+]e and in DC potential. In addition, we found spontaneous oscillations (5.6±0.44 cycles/min, data not shown) in CBF, NADH and in reflectance (in most cases) during the recordings (exemplified in trace 2B before KCl application).
Arterial blood samples were taken during normoxia and hypoxia (after reaching steady state conditions). Hypoxia, showed a significant decline in pO2 (from 107.73±4.9 to 57.18±8.62 mmHg, p<0.005), in pCO2 (from 34.23±2.1 to 26.38±2.9 mmHg, p<0.005), in O2 saturation (from 96.01±0.47% to 81.06±5.37%, p<0.005) and in O2 content (from 19.33±2.1 to 15.96±1.64 Vol %, p<0.005). In addition, mean arterial blood pressure (detected in a different group of 7 rats in our Lab) decreased significantly (from about 110 mmHg to 80 mmHg) during hypoxia.
2. Responses to CSD During Hypoxia
Fig. (2) is an analog tracing that illustrates the effect of CSD on the brain cortex during normoxia (A) and hypoxia (B) of the same animal. CSD during normoxia (A) caused a biphasic response in reflectance, an increase that was followed by a decrease. Mitochondrial NADH decreased showing an oxidation cycle, CBF and [K+]e increased and DC potential decreased. During hypoxia (B), the increase in reflectance augmented and the decrease phase reduced. NADH and CBF under hypoxic conditions changed their responses to CSD: in NADH an initial reduction cycle that was followed by a small oxidation one; CBF declined parallel to the increase in NADH and later on, a small increase was seem, which was accompanied by the small oxidation cycle in NADH. CSD during control conditions showed that the maximum (peak) in [K+]e occurred parallel to the minimum (peak) in NADH (maximum oxidation) whereas the CBF increase, started afterwards reaching the maximum level about 45 seconds later. In contradiction, the maximum (peak) in [K+]e occurred parallel to the reduction cycle in NADH and the decrease in CBF (Fig. 2B dotted lines). In addition, CSD wave duration prolonged during hypoxia as compared to normoxia.
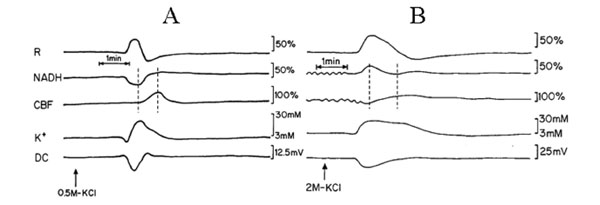
Analog tracings presenting the effect of CSD initiation during normoxia (A) and hypoxia (B). R – reflectance, NADH – mitochondrial NADH redox state; CBF– cerebral blood flow; K+e – corrected extracellular potassium concentration; DC – DC steady potential. The arrows indicate the moment of KCl solution application for induction of CSD wave. Dotted lines in 2A and 2B mark the simultaneous minimum and maximum responses in CBF and NADH during CSD.
Fig. (3) presents mean± S.E. of maximum and minimum levels of reflectance, CBF and NADH during induced CSD (2 waves) under normoxic (control) and hypoxic conditions.
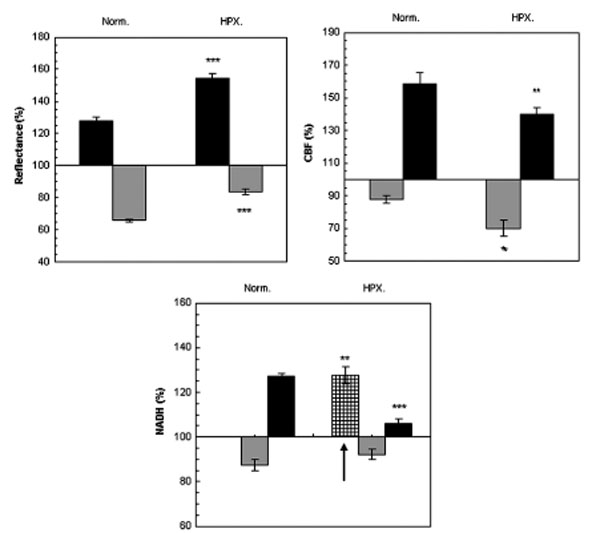
The effect CSD wave propagation on maximum (VTmax-black bars) and minimum (VTmin-gray bars) amplitudes of reflected light (reflectance), cerebral blood flow (CBF) and mitochondrial NADH redox state under normoxic (Norm.) and hypoxic (HPX.) conditions. Arrow signs the initial reduction wave in NADH (grid bar) recorded during hypoxia. Data are presented as mean ± S.E. * p < 0.05, ** p < 0.005, *** p<0.0005 CSD during normoxia vs. CSD during hypoxia.
Reflected light changed in a biphasic pattern, an increase that was followed by a decrease. Under hypoxia, the increase phase was found significantly larger (p<0.001) and the decline was significantly smaller (p<0.001) compared to CSD under normoxic conditions.
CBF changes during CSD: during normoxia an augmentation, of about 70%, in CBF was found, which was accompanied by an initial decline of about 15%. This decline in CBF increased (25%), during hypoxic conditions (p<0.01). The maximum elevation in CBF during hypoxia was significantly (p<0.01) lower as compared to the parallel wave in the control group. A recovery in CBF was found one hour later (after the hypoxic period) under normoxic conditions.
NADH changes during CSD: during hypoxia, an initial and significant (p<0.01) reduction in NADH was found, before the biphasic wave (an oxidation followed by a reduction). The late reduction wave (after the oxidation) was significantly smaller (p<0.001) compared to normoxic conditions. CSD induced, under normoxic conditions, one hour after hypoxia (data not shown), showed a complete recovery from the hypoxic period.
Baseline extracellular K+ concentrations (not shown) were between 2-3 mM. During CSD propagation, [K+]e increased by 16.5±1.34, 18.3±1.9 and 15.2±2.0 mM under normoxia, hypoxia and normoxia one hour after hypoxia, respectively. No significant differences in delta [K+]e where found between the three CSD waves.
Baseline extracellular DC steady potential values were between -1.2 to about 1.6 mV. During CSD, DC steady potential decreased by (delta) -14.7±0.3, -16.1±0.5 and -15.5±0.3 mV under normoxia, hypoxia and normoxia one hour after hypoxia, respectively. No significant differences in delta DC potential were found between the three CSD waves.
NO Synthase Inhibition
1. Brain Responses After L-NAME Injection
L-NAME injection (IP) of 50 mg/kg caused significant changes in baseline levels of the measured parameters: CBF declined and the changes presented here are one and two hours after the injection (from 101.5±2.0% to 79.8±3.4%, p<0.005; from 99.8±3.1% to 61.6±6.2%, p<0.005) respectively. Mitochondrial NADH increased and reached a significant level only 2 hours after L-NAME injection (from 109.7±4.8% to 133.9±12.4%, p<0.05). Extracellular K+ baseline levels also increased significantly (from 3.8±0.3 mM to 4.2±0.3 mM, p<0.002; from 3.8±0.3 mM to 4.7±0.7 mM, p<0.05) one and two hours after the injection of L-NAME, respectively. In addition DC levels increased but showed significant changes only during the first hour after L-NAME injection (from -0.6±0.4 to 0.5±0.2 mV, p<0.01). Spontaneous oscillations (in the same rate as during hypoxia) in CBF, NADH and in reflectance were found after L-NAME injection.
In parallel, an additional study in our laboratory showed that the same dose caused a significant increase (of about 30%) in blood pressure – a typical known reaction after NOS inhibition [22, 32].
2. Responses to CSD After NOS Inhibition
Two sessions of CSD waves (one at a time) were induced after L-NAME IP injection (a single dose of 50 mg/kg): one hour (L-NAME1) and two hours after the injection (L-NAME2). Typical effects of CSD on the measured parameters (in one rat), before and after L-NAME injection are shown in Fig. (4). CSD caused an initial increase in NADH, as found also during hypoxia (Figs. 2, 3). The increase phase in reflectance augmented where the decrease phase reduced, and the increase in CBF, during CSD, was preceded by an initial decline. CSD wave duration prolonged (Table 1), showing a decline in energy production after L-NAME administration.
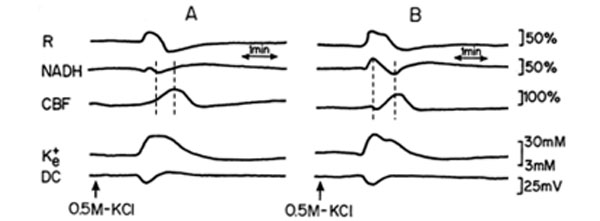
Analog tracings presenting the effect of CSD propagation on the measured parameters, during normoxia (A), and one hour after a single dose of 50 mg/kg L-NAME injected IP (B), respectively. R – reflectance, NADH – mitochondrial NADH redox state; CBF – cerebral blood flow; K+e – corrected extracellular potassium concentration; DC – DC steady potential. The arrows indicate the moment of KCl solution application for CSD wave induction. Dotted lines in 4A and 4B mark the simultaneous minimum and maximum responses in CBF and NADH during CSD.
The Effect of Hypoxia, L-NAME (L-NAME1) and Ischemia on CSD wave Duration (Minutes, Mean±SEM) Until the Initial Recovery
| Parameter | Normoxia (N=13) | Hypoxia (N=13) | Normoxia (N=10) | L-Name1 (N=10) | Normoxia (Sham) (N=8) | Ischemia (N=7) |
|---|---|---|---|---|---|---|
| Reflectance | 1.54±0.0 | 2.99±0.03*** | 1.88±0.12 | 2.59±0.25* | 1.63±0.1 | 3.73±0.5*** |
| NADH | 1.59±0.06 | 2.45±0.12 | 1.90±0.10 | 1.97±0.11 | 1.54±0.4 | 1.81±0.3 |
| CBF | 2.12±0.04 | 3.02±0.08 | 1.98±0.13 | 1.80±0.08* | 1.98±0.4 | 3.37±0.5* |
| K+e | 1.94±0.04 | 2.91±0.04* | 2.06±0.11 | 2.67±0.16*** | 1.80±0.1 | 2.50±0.2*** |
| DC | 2.05±0.03 | 4.05±0.08*** | 1.51±0.12 | 2.02±0.35 | 1.64±0.1 | 2.13±0.4 |
NADH fluorescence; CBF - cerebral blood flow; K+e - extracellular K+ concentrations; DC-DC potential
* p< 0.05
*** p<0.005
Fig. (5) presents the effect of CSD after L-NAME injection on the average amplitude values ± S.E. of reflectance, CBF and mitochondrial NADH redox state.
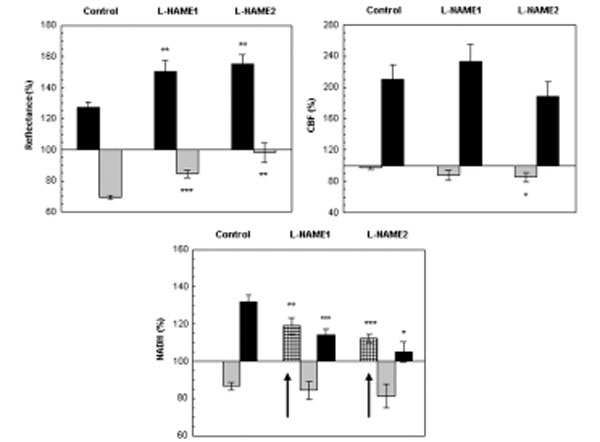
The effect CSD wave propagation on maximum (VTmax-black bars) and minimum (VTmin-gray bars) amplitudes of reflected light (reflectance), cerebral blood flow (CBF) and mitochondrial NADH redox state under normoxic (control) and after a single dose of L-NAME injected IP. L-NAME1 – CSD induced one hour after L-NAME injection and L-NAME2, CSD induced 2 hours after L-NAME injection. Arrows sign the initial reduction wave in NADH (grid bar) recorded during CSD. Data are presented as mean ± S.E. * p<0.05, ** p<0.005, *** p<0.0005 CSD during normoxia vs. CSD after L-NAME.
Reflectance changed in a biphasic wave manner, an increase followed by a decrease. After L-NAME, the increase augmented significantly (p<0.005) and the decrease, declined significantly (p<0.0005) as compared to CSD under normoxia. CBF also responded in a biphasic pattern, a small initial decline that was followed by a large and significant increase (of about 100%). The elevated wave in CBF after L-NAME was similar to the normoxic CSD, except for the initial decrease that became significantly grater (p<0.05) during the second hour after L-NAME induction. An initial and significant reduction (p<0.01, p<0.001 L-NAME1 and L-NAME2, respectively) in NADH was seen before the oxidation-reduction cycles, during both CSD waves initiated after L-NAME administration. Furthermore, the late reduced cycle in NADH decreased significantly (p<0.001, p<0.05 L-NAME1 and L-NAME2, respectively). In addition the increases in extracellular K+ levels as a result of CSD were 16.26±2.05, 17.76±2.63, 16.16±2.63 during control, L-NAME1 and L-NAME2, respectively, and were not found significantly different.
Responses to CSD Under Partial Ischemia
The monitoring period of this group started 24 hours after the occlusion of the two carotid arteries. Hence, we assumed that the brain tissue was in a new steady state condition where the real values of the parameters CBF, reflectance and NADH were not known. Therefore, for calculations we considered these baseline levels as control (100%) and compared all changes to it. In addition, spontaneous oscillations were seen during ischemia, in CBF, reflectance and in NADH during the recordings, in an identical rate as seen during hypoxia and after L-NAME administration. The oscillations in mitochondrial NADH were found parallel and in an opposite direction to CBF.
Inductions of CSDs under ischemic conditions caused 3 kinds of variable responses (in different rats) in the measured parameters and are demonstrated in Fig. (6). Fig. (6A) shows that during CSD NADH increased, CBF decreased first, and only later, increased slightly (during the recovery phase). Extracellular K+ increased and DC potential decreased. Trace 6B shows a large increase in reflectance followed by a small decrease, an increase followed by a decrease in NADH redox state, and a clear initial deep decrease in CBF, that was followed by an increase. Trace 6C shows an increase in NADH and in CBF. In all the ischemic traces (Fig. 6) reflectance changed in a biphasic manner, an increase that was followed by a decrease and the time to recovery from CSD was prolonged (in all the measured parameters) as compared to normoxic conditions (for example Figs. 2A, 4A).

Fig. (7) shows the mean ± S.E. % values of reflectance, CBF and NADH during CSD induced in sham and ischemic brains. The increases in [K+]e levels were up to 18.38±1.51mM and 19.31±2.74mM and the decreases in DC potential were of 13.6±0.5mV and 12.86±0.56 mV in sham and ischemic rats, respectively. No significant differences were found in [K+]e and in DC potential between sham and ischemic rats. In the ischemic experiments, reflectance changed in a biphasic pattern as during normoxia but the increase phase was significantly higher (p<0.005) during ischemia indicating a grater decrease in tissue blood volume during CSD under ischemic conditions as compared to sham.
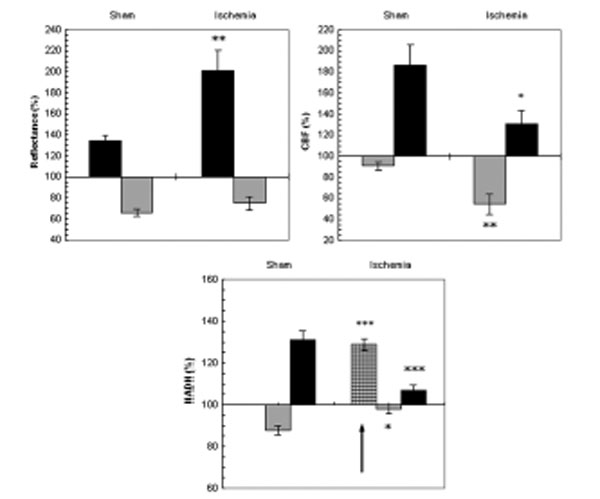
The effect of CSD wave propagation on maximum (VTmax-black bars) and minimum (VTmin-gray bars) amplitudes of reflected light (reflectance), cerebral blood flow (CBF) and mitochondrial NADH redox state on normoxic (sham) and partial ischemic brains. Arrows sign the initial reduction wave in NADH (grid bar) recorded during CSD. Data are presented as mean ± S.E. * p<0.05, ** p<0.005, *** p<0.0005 of CSD on sham brains vs. CSD on partial ischemic brains.
CBF during CSD under normoxic conditions (sham) showed a decline that was followed by a large increase whereas, during ischemia the initial decrease was significantly larger (p<0.005) and the increase phase was significantly smaller (p<0.05).
NADH during CSD changed in a biphasic pattern in the sham rats: an oxidation wave was followed by a reduction one. Whereas, in the ischemic brain an initial and significant (p<0.0005) reduction of about 30% was found before the biphasic pattern. Furthermore, the oxidation wave was significantly smaller (p<0.05) and so was the late reduction cycle (p<0.0005).
CSD wave durations under hypoxia, ischemia and one hour after L-NAME administration are summarized in Table 1. The data shows that the recovery from CSD prolonged in most measured parameters, during these pathological conditions, where oxygen availability to tissue was limited.
The Interrelation Between CBF and NADH Redox State During CSD
Extracellular [K+] during CSD increased similarly during all conditions tested (no statistical differences were found). In contradiction, the simultaneous measurements of CBF and NADH during CSD propagation, showed different trends, compared to normoxic conditions, and illustrated in Figs. (2, 4 and 6) by dotted lines. The parallel changes in CBF and NADH during CSD under normoxic conditions (Figs. 2A and 4A) were totally different as compared to the three other conditions (Figs. 2B, 4B, 6A, 6B, 6C): under normoxia the oxidation in NADH preceded the maximum increase in CBF (Figs. 2A, 4A), whereas during hypoxia, ischemia and after L-NAME administration an initial reduction cycle in NADH was seen in parallel to the initial decrease in CBF (first dotted line in 2B, 4B, 6A, 6B, 6C) which raised during these pathological conditions. The increase in CBF during CSD (second dotted line in Figs. 2B, 4B, 6A, 6B, 6C) was observed afterwards. Parallel to the increase in CBF a decrease in NADH (oxidation) was observed. These results can demonstrate a different interrelation between CBF and NADH during CSD under these pathological conditions compared to control.
DISCUSSION
The results in the current study show that induction of CSD caused an increase in extracellular K+ that reached identical levels under all perturbations tested, showing that the increase in oxygen demand by inducing CSD reached equal levels under normoxia, hypoxia, ischemia and after L-NAME administration (Figs. 2, 4, 6 and data (Mean±S.E) reported in pages 5, 6, 7). In healthy and normal tissue, these changes in ion homeostasis are associated with CBF and oxygen delivery elevation, leaving the tissue intact for many hours [10]. But for tissue in which blood flow or oxygen delivery is disturbed, compensation will be reliable on the availability of oxygen. Furthermore, increasing oxygen demand under such circumstances can cause a chain of events that will enhance or lead to brain damage: such as disruption in ion homeostasis, acidosis, release of glutamate and excitatory amino acids (EEAs) etc [11, 19].
Brain Responses to NO Synthase Inhibition
We found that L-NAME injection decreased CBF levels, as was found by previous studies investigating the effect of NOS inhibition [22, 33-35]. In parallel, we found an increase in mitochondrial NADH showing a decline in oxygen delivery to the brain tissue which may reduce tissue oxygen balance. In addition, some studies [22, 33, 36] showed that L-NAME did not cause changes in arterial blood gases. Macrae showed [36] that NOS inhibition by L-NAME caused a decline in CBF in different brain areas which was not associated by a reduction in glucose consumption. Also Iadecola et al. in their review article [22] showed that oxygen and glucose consumption did not change as a result of NOS inhibition. Furthermore, Brown [37, 38] hypothesized and showed that NO is responsible to mitochondrial respiration regulation by inhibiting cytochrome oxidase. Therefore, the inhibition of NOS can lead to an increase in oxygen consumption [38]. Kurzelewski, et al., [39] found, in isolated rat heart, that inhibition of NOS resulted in an increase in oxygen consumption but did not affect glucose or FFA oxidation. Our results showed an increase in mitochondrial NADH redox state which can result from the increase in oxygen consumption due to NOS inhibition by L-NAME. Besides, the elevation in extracellular K+ can indicate that Na+-K+-ATPase turnover decreased, which can signify a decrease in energy production. In addition, NADH elevation may also occur due to the decline in CBF which reduced oxygen delivery and lead to ATP depletion in the brain tissue.
Responses to CSD Under NO Synthase Inhibition
NO is known to be involved in regulation of CBF following neuronal activation [40]. In addition, it was shown that the mechanism of CSD propagation involves activation of glutamate and NMDA receptors [41] which causes postsynaptic calcium influx triggering NOS activation [22, 34, 42]. Thus, the question is whether NO is involved in the noticed vascular changes and in CBF regulation during CSD propagation? The early increase in reflectance and the decrease in CBF (CSD during the second hour after L-NAME administration) before the large increase (Figs. 4, 5) could result from the vasoconstriction effect due to the increase in extracellular K+ concentrations (Fig. 4) resulted from neuronal depolarization following CSD propagation. A brief similar decline in CBF was seen by others [33, 34, 36] showing that NO could play an important vasodilative role during the early phase of CSD. The brief decline in CBF consequences an initial increase in reflectance and reduction in NADH (Figs. 4, 5) showing a decrease in blood volume and oxygen delivery during the brief phase of CSD after L-NANE administration. During the second phase of CSD, oxidation cycles were observed in NADH, parallel to a large increase in CBF that did not differ in amplitude changes from the control CSDs. These results indicate that other mediators than NO take a role in the vasodilatation mechanism during the hyperperfusion phase of CSD. Similar [33, 43, 44] and different [45, 46] results were found by others, where Akgoren and Dirnagl groups concluded that NO plays an important role in the coupling mechanism between CBF and neuronal activation. In addition, in rabbits and cats the CSD hyperperfusion phase decreased after NOS inhibition [27, 28, 47] which can indicate that the effect of NO on CBF changes during CSD may depend on the species investigated. However, although we found an increase in CBF during the second phase of CSD, the increase in wave duration (Table 1) may indicate that inhibition of NOS leads to energy depletion, which prolongs the brain tissue ability to recover from an increase in oxygen demand caused by CSD.
Brain Responses to Hypoxia
Systemic hypoxia decreased arterial blood pressure and arterial pO2. The reduction in mean arterial blood pressure was found similar to the “hypoxia normotension” conditions reported by Sukhotinsky et al., [48]. In addition, the decline in arterial pO2 stimulated the production of a wide variety of vasodilator metabolites, such as adenosine, NO, Ca2+, H+ and K+ levels, prostaglandins and others, causing an increase in CBF [49]. It seems that the concomitant increase in CBF did not succeed completely to compensate the brain's tissue oxygen demand and as a result, a significant increase in mitochondrial NADH was noticed (see results section page 4). In the review article of Mayevsky and Rogatsky [9], the authors showed that mitochondrial NADH increased in an inversely correlation to the decrease in FiO2 levels.
Responses to CSD Under Hypoxia
The initial phase, during CSD under systemic hypoxia, showed a brief decline in oxygen supply (CBF decreased and reflectance increased) and in oxygen balance (initial reduction in NADH) (Figs. 2, 3). Identical results were shown by others [48]. This initial decline in CBF can result from the increase in extracellular K+ levels that is known to affect vasoconstriction [2, 7, 50, 51], and consequently an added initial reduced phase (increase) in NADH redox state (Fig. 2B). In addition, tissue hypoxia can increase NO levels which may inhibit mitochondrial respiration [37, 38, 52] causing an additional increase in NADH and deplete ATP levels. Additionally, the increased phase in CBF (hyperperfusion phase) was also diminished significantly (Figs. 2B, 3) which can result from the initial high levels of vasoactive substances already present in the microcirculatory bed (resulted from the hypoxia), and therefore the hemodynamic responses to CSD are reduced. This decline in oxygen supply and in ATP levels prolonged wave duration and slowed down the recovery time from CSD (Table 1) during hypoxia. Similar results were shown in our previous studies [7, 53] as well identical changes in CBF, DC potential and in wave duration were reported by others [48].
Responses to CSD Under Partial Ischemia
We used the bilateral common carotid arteries occlusion as a model for partial ischemia. Several works on rats and gerbils showed that occlusion of one or both carotid arteries caused a decrease in CBF and an increase in NADH [54, 55]. The increase in NADH was found proportional to the decline in CBF [55] and was accompanied by changes in ionic homeostasis [2, 55-57].
Our data shows that induction of CSD waves on partial ischemic brains resulted in about 3 types of variable changes in the measured parameters, which were expressed in the amplitude levels of reflectance, CBF and NADH (Fig. 6). The variable reactions to CSD under ischemia could result from a variability in the intensity of brain tissue damage resulted from the bilateral carotid occlusion.
The initial increase in reflectance, the initial decline in CBF and the early increase (reduction cycle) in NADH fluorescence (Figs. 6, 7) can indicate a reduction in blood flow and volume (reflectance) and a decline in oxygen delivery to the ischemic brain tissue, during the early phase of CSD. The decline in CBF can also be explained as a result of microcirculatory vasoconstriction caused by the increase in extracellular K+ levels. Identical results during CSD were shown under hypoxic conditions (Figs. 2, 3), in our previous study [7] and by others [48]. In addition, we showed [53] a decrease in tissue HbO2 parallel to the increase in NADH. Also Back et al., [58] showed a further decrease in tissue pO2 and no changes in CBF during spontaneous CSDs after Middle Cerebral Artery occlusion. Besides, our data shows that the hyperperfusion phase during CSD decreased, and the oxidation wave in NADH almost disappeared. These findings indicate that increasing oxygen demand (by CSD) in the ischemic brain, limits tissue abilities to compensate these deficiencies leading to a reduction in Na+K+ATPase pump turnover, which prolongs the recovery from CSDs (Tables 1). Similar responses in wave duration were reported by others [58] and by our group [7, 59].
The Interrelation Between CBF and NADH Redox State During CSD
Our data indicate that inhibition of NO synthesis, hypoxia or partial ischemia resulted in a decline in energy production, caused by a disruption in the balance between O2 supply and O2 demand (Figs. 2-7). The metabolic and hemodynamic oscillations that were observed after induction of each of the tested pathological conditions, suggest a dynamic linkage between metabolic and vascular processes, which can indicate a tight coupling between oxygen supply (CBF) and energy balance (NADH). Identical observations, during partial ischemia, after L-NAME injection, after CO poisoning and brain trauma, were found in previous studies [60, 61].
According to our results, extracellular K+ (oxygen demand) during CSD propagation, increased to identical levels under normoxia and the three pathological conditions tested, showing that oxygen demand during the tested conditions, was found identical. In contradiction, oxygen supply (CBF) and oxygen balance (mitochondrial NADH redox state) differ in amplitude values and in the simultaneous nature responses during CSD propagation, between normoxia and the pathological conditions tested (Figs. 2-7). The basic tight coupling between NADH and CBF found by the inverse oscillations between these parameters, under the pathological conditions tested, may dictate the simultaneous changes found in NADH and CBF, during CSD propagation, under hypoxia, ischemia and after L-NAME induction.
CONCLUSIONS
- CSD induced, under conditions where oxygen delivery is reduced or disturbed, increases oxygen demand to the same level as during normoxic conditions, whereas oxygen supply (CBF) can further decrease and oxygen balance (NADH) is disturbed;
- CSD wave duration increased under conditions where oxygen supply was reduced, indicating a reduction in energy formation;
- The tight coupling between CBF and NADH under limited O2 supply conditions seems to be stronger than under normoxic conditions as disclosed after increasing O2 demand by CSD;
- Our results demonstrate the significance of simultaneously monitoring extracellular K+ (oxygen demand), CBF (oxygen supply) and mitochondrial NADH (oxygen balance) for reliable discernment between normal brain and conditions where oxygen balance is impaired.
CONFLICT OF INTEREST
None declared.
ACKNOWLEDGEMENT
None declared.

