All published articles of this journal are available on ScienceDirect.
Effects of Consonant-Vowel Transitions in Speech Stimuli on Cortical Auditory Evoked Potentials in Adults
Abstract
We examined the neural activation to consonant-vowel transitions by cortical auditory evoked potentials (AEPs). The aim was to show whether cortical response patterns to speech stimuli contain components due to one of the temporal features, the voice-onset time (VOT). In seven normal-hearing adults, the cortical responses to four different monosyllabic words were opposed to the cortical responses to noise stimuli with the same temporal envelope as the speech stimuli. Significant hemispheric asymmetries were found for speech but not in noise evoked potentials. The difference signals between the AEPs to speech and corresponding noise stimuli revealed a significant negative component, which correlated with the VOT. The hemispheric asymmetries can be referred to rapid spectral changes. The correlation with the VOT indicates that the significant component in the difference signal reflects the perception of the acoustic change within the consonant-vowel transition. Thus, at the level of automatic processing, the characteristics of speech evoked potentials appear to be determined primarily by temporal aspects of the eliciting stimuli.
1. INTRODUCTION
During the auditory perception of speech, the central hearing has to process complex acoustic structures in real-time. Adequate processing of acoustic information is the requirement for speech and language development [1]. Particularly, disorders in the temporal processing are supposed to be responsible for deficient auditory discrimination abilities, which can result in an impaired speech perception [2]. Cortical auditory evoked potentials (AEPs) provide an objective method with high temporal resolution for the investigation of auditory speech processing.
In the absence of attention, AEPs represent the automatic cortical processing on auditory sensory level. In this case, AEPs are dominated by obligatory components. In adults, these components are particularly the N1 and P2, also called N1/P2 complex [3]. The N1/P2 complex is thought to reflect the synchronous neural activity of structures in the thalamic-cortical segment of the central auditory system. The N1, a negative peak occurring approximately 100 ms after stimulus onset, is suggested to represent sound detection functions [4], since it is sensitive to onset sound features, such as intensity and interstimulus interval. For example, it could be demonstrated that the N1 indicates segmentation during the perception of continuous speech [5]. P2, a positive peak occurring approximately 200 ms after stimulus onset, is assumed to reflect sound content properties like acoustic or phonetic structures [6].
Several investigators have examined the possibility of using AEPs to determine the individual discrimination ability of phonetic structures in speech sounds [7-10]. Of particular interest are stimulus features constituting minimal pairs, such as formant gradients of consonant vocal-transitions and the voice onset-time (VOT). VOT is defined as the interval between the release from stop closure and the onset of laryngeal pulsing [11]. Sharma and colleagues (1999) investigated the morphology of speech evoked potentials in absence of attention depending on the subjective perception of stop consonants. Analyzing the cortical responses to a /da/-/ta/ continuum they found that stimuli with short VOTs (0–30 ms) evoked a single N1, whereas stimuli with long VOTs (50–80 ms) evoked two distinct negative components (N1’ and N1). This discontinuity in AEP morphology was in line with the subjective perception of voiceless sounds and thus, it was suggested to represent an electrophysiological correlate of categorical perception [7]. However, in another study using a /ga/-/ka/ continuum as stimuli, the change in N1 morphology to a double-peaked component did not signal subjective perception of a voiceless sound. This result indicated that the minimum VOT value of 40 ms required for the temporal separation of N1 depends on acoustic properties of the stimulus rather than the perceptual categorization [8].
Martin et al. investigated cortical responses to syllables with different formant transitions embedded in masking noise [12]. The stimuli evoked an N1 which systematically changed with the stimulus energy (which is a sound onset feature), but not with the individual subjective discrimination.
Ostroff et al. compared the cortical response to the syllable /sei/ with the cortical responses to the sibilant /s/ and to the vowel /ei/. They ascertained that the response to /sei/ was a combination of the AEPs to the onsets of the two constituent phonemes /s/ and /ei/ [13]. These overlapping AEPs within one stimulus response have been termed the acoustic change complex (ACC) [14]. The ACC is supposed to be composed of different N1/P2 complexes reflecting the acoustic changes across the entire stimulus [15].
Overall, the aforementioned studies indicate that speech evoked potentials primarily reflect the phonetic composition of the stimuli. The aim of the presented study was to investigate whether cortical responses to speech stimuli contain AEP components referring to the VOT. For this purpose, AEPs to four natural monosyllabic words were compared with AEPs to noise stimuli showing the same temporal envelope as the word stimuli [16]. For a systematic analysis of the cortical responses, the speech stimuli were chosen with respect to varying VOTs.
2. MATERIALS AND METHODOLOGY
2.1. Participants
We examined 7 normal-hearing, right-handed monolingual native German speakers (3 female, 4 male). The age range was 22 to 27 years. None was on medication at that time. All participants signed an informed consent.
2.2. Stimuli and Procedure
In this study, two types of stimuli were used to elicit electrophysiologic responses: speech stimuli and noise sound stimuli. The speech stimuli consisted of four monosyllabic words naturally produced by a male speaker, taken from Freiburger speech discrimination test [17]. The stimuli were Ei /a:i/, Bett /bεt/, Dieb /di:b/, and Pult /pult/, which mean egg, bed, thief and desk. The durations of the stimuli Ei, Bett, Dieb, and Pult were 544 ms, 430 ms, 501 ms, and 567 ms, respectively. The speech stimuli exhibited a bandwidth of 8 kHz and were digitalized with 14 bit at a sampling rate of 20,000 s-1. Except Ei, all speech stimuli started with an initial stop consonant and were chosen with respect to their varying VOT. The VOTs were determined as VOT(Ei) = 0 ms, VOT(Bett) = 35 ms, VOT(Dieb) = 60 ms, and VOT(Pult) = 80 ms. The onset times of the closing consonants which succeed the vowels were determined as 215 ms with Bett, 390 ms with Dieb, and 395 ms with Pult.
The speech stimuli served as raw material for the synthesis of the noise stimuli. Noise stimuli were created by randomly multiplying the discrete samples of the speech stimuli with ± 1 and subsequent 8 kHz low pass filtering. Fig. (1) shows exemplarily the generation of the noise stimulus corresponding to Dieb. Thus, any phonetic information was removed from the speech stimuli, whereas the intensity was held constant. By this means, the synthesized noise stimuli EiN, BettN, DiebN, and PultN were generated.
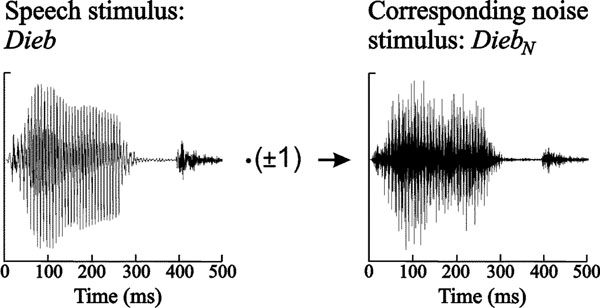
Speech stimulus Dieb and synthesized noise stimulus DiebN. Both stimuli exhibit the same temporal envelope but phonetic information is discarded in the noise stimulus.
Spectrograms of all presented stimuli are depicted in Fig. (2). The speech stimuli mainly consisted of frequencies lower than 2 kHz, whereas the noise stimuli were distributed over the entire bandwidth of 8 kHz.
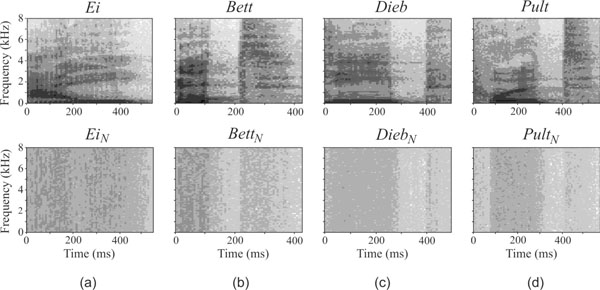
Spectral view of the presented stimuli. Top: Natural spoken monosyllabic words. Bottom: Synthetic noise sounds, derived from the monosyllabic words. Bandwidth of the stimuli is 8 kHz.
For equated presentation loudness, the applied stimuli were calibrated with respect to their root mean squares to a 1 kHz reference tone with an intensity level of 70 dB SPL (see [18]). Stimuli were presented in four blocks of 320 sounds each. Within the block, all stimuli were successively presented 40 times in the order of speech and corresponding noise stimulus (speech-noise pairs). Thus, each stimulus was presented 160 times. The interstimulus interval varied randomly between 1400 and 2100 ms. Subjects were tested in a soundproof booth. In order to minimize effects of the subjects’ state of attention on the applied stimuli, they were asked to watch a silent movie presented on a TV screen.
2.3. EEG Recording and Data Processing
The EEG was derived with Ag/AgCl electrodes, which were integrated in a cap (Braincap, Brain Products GmbH, Gilching, Germany) with 30 fixed electrode positions (Fp1, Fp2, F3, F4, C3, C4, P3, P4, O1, O2, F7, F8, T3, T4, P7, P8, Fz, FCz, Cz, Pz, FC1, FC2, CP1, CP2, FC5, FC6, CP5, CP6, TP9, TP10). The electrode impedances were kept below 5 kOhm. For eye artefact rejection, an electro-oculogram was recorded by an electrode placed under the right eye. The EEG was recorded with Brain Amp-MR (Brain Products GmbH, Gilching, Germany) at a sampling rate of 500 Hz and digitalization of 16 bit.
During data acquisition, all channels were referenced to FCz. Offline, data were re-referenced to the mean of TP9 and TP10. The EEG was 0.13 Hz – 20 Hz band pass filtered with a slope of 12 dB/octave. The recording window included 100 ms prestimulus and 700 ms poststimulus time. Sweeps with artefacts measuring higher than 75 µV were rejected. The remaining sweeps were averaged separately for each stimulus and prestimulus baselined.
For each stimulus, grand mean waveforms were composed and grand mean latencies of the AEP components were visually identified. The individual peak latencies were determined in a time interval of the central latencies ± 24 ms. Amplitudes were calculated as a mean voltage at the 20 ms period centered at the individual peak latencies.
2.4. Data Analysis
In the first step, statistical comparative tests of the AEP characteristics were carried out for both stimulus types, i.e. speech and noise stimuli, separately. In the second step, cortical responses to speech and corresponding noise sounds were analysed and compared among each other.
2.4.1. Responses to Speech and Noise Stimuli
Preliminary one-way analyses of variance (ANOVA) were conducted to determine the scalp distribution of the amplitudes of N1 and P2. Since the largest responses for all stimuli were obtained at central positions, channel Cz was chosen for following one-way ANOVAs, which examined N1 and P2 latencies and amplitudes of the distinct speech and noise elicited AEPs. Newman-Keuls tests were carried out as post hoc analyses for the determination of equal-mean subsets. For the examination of hemispheric differences, N1-P2 interpeak amplitudes of the lateral scalp sites (T3, FC5, C3 vs. T4, FC6, C4) were compared via paired t-tests.
2.4.2. Speech-Noise Pairs
For each subject time intervals were determined, in which speech and corresponding noise responses statistically differed. For this purpose, the sampling values of the single recorded sweeps in response to each stimulus were pooled for every discrete time step independently, resulting in 350 samples of speech and noise responses each (700 ms post-stimulus interval x 500 s-1 EEG sampling rate). Speech response samples of every time step were compared to the corresponding noise response sample by Student’s two-tailed t-test. As level of significance p<0.01 was selected. In order to avoid Bonferroni problems due to the large number of compared samples, a statistical difference between speech and noise response was accepted, when at least 12 consecutive sampling points (i.e., 24 ms interval) showed significance [19].
On average level, difference signals were created by subtracting the noise elicited AEPs from the corresponding speech elicited AEPs. Latencies and amplitudes of occurring components in the difference signals were determined visually. Amplitudes were tested for significant appearance via one-tailed t-test.
3. RESULTS
3.1. Responses to Speech and Noise Stimuli
Preliminary one-way ANOVAs, which separately analysed N1 and P2 peak amplitudes, revealed significant amplitude differences between the electrode sites for both, speech and noise stimuli (p < 0.001, F26,162 = 3.3 – 8.6). Newman-Keuls post hoc analysis revealed that with all stimuli, the greatest amplitudes were elicited in the central area of the scalp (i.e., channels Cz3, Cz, Cz4) for both, N1 and P2 amplitude. Hence, the following illustrations and statistics are restricted to channel Cz. Fig. (3a) shows the grand mean waveforms of the cortical responses to the four different speech stimuli. Morphologies of the speech-evoked potentials differed clearly across the stimuli. AEPs in response to Bett and Pult appear to reveal multiple overlapping response patterns. In all subjects, the predominant components were N1 and P2 in all responses. All speech stimuli elicited an N1 component which peaked around 113 ± 8 ms, and a P2 component that peaked in a range from 180 to 260 ms around 207 ± 36 ms.
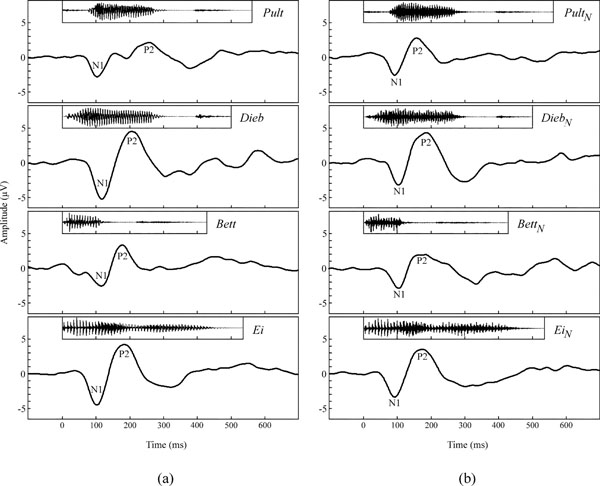
(a) Grand mean waveforms of speech stimuli elicited AEPs in response to Ei, Bett, Dieb, and Pult at channel Cz. (b) Grand mean waveforms of noise-sound elicited AEPs in response to EiN, BettN, DiebN, and PultN at channel Cz.
Fig. (3b) shows the grand mean waveforms of the cortical responses to the four different noise stimuli. The waveforms of the different noise sound elicited AEPs were similar. The predominant components in all responses were N1 and P2. All noise stimuli elicited an N1 component which peaked around 103 ± 8 ms, and a P2 component that peaked around 175 ± 11 ms.
In Tables 1 and 2, N1 and P2 latencies and amplitudes of both stimulus types are given. Table 3 shows F values of one-way ANOVAs, conducted to reveal significant differences of these characteristics. Newman-Keuls post hoc tests did not show consistent correlations within a subset of both stimulus types. As it is apparent from the higher levels of significance, speech evoked AEP characteristics diverged stronger among each other than those evoked by noise sounds.
Mean Latencies of N1 and P2 in ms Elicited by the Speech/Noise Stimuli at Channel Cz
| Peak | Stimulus Type | Ei | Bett | Dieb | Pult |
|---|---|---|---|---|---|
|
|
|||||
| N1 | Speech | 106 (4) | 119 (8) | 120 (5) | 107 (7) |
| Noise | 95 (8) | 111 (7) | 108 (7) | 97 (7) | |
|
|
|||||
| P2 | Speech | 183 (12) | 181 (8) | 206 (12) | 259 (10) |
| Noise | 177 (15) | 181 (16) | 185 (10) | 160 (12) | |
Standard deviations are in parentheses.
Mean Amplitudes of N1 and P2 in µV Elicited by the Speech/Noise Stimuli at Channel Cz
| Peak | Stimulus Type | Ei | Bett | Dieb | Pult |
|---|---|---|---|---|---|
|
|
|||||
| N1 | Speech |
-3.82 (1.29) | -2.36 (1.04) | -4.45 (1.54) | -2.36 (1.36) |
| Noise | -3.01 (1.58) | -2.28 (1.48) | -2.58 (1.33) | -2.03 (1.04) | |
|
|
|||||
| P2 | Speech | 4.00 (1.29) | 2.75 (1.18) | 4.40 (1.50) | 1.99 (0.57) |
| Noise | 3.22 (1.01) | 2.35 (0.85) | 4.11 (1.46) | 2.49 (0.90) | |
Standard deviations are in parentheses.
For the analysis of hemispheric asymmetries, a paired t-test was conducted with N1-P2 interpeak amplitudes of opposite channel pairs T3 – T4, FC5 – FC6, and C3 – C4, continuing from lateral to central. The mean N1-P2 interpeak amplitude of T3 was significantly smaller than that of T4 for the speech stimuli but not for the noise stimuli, see t values in Table 4. While N1-P2 interpeak amplitudes at the positions FC5 and FC6 did not differ, an inversion from right to left hemispheric predominance occurred at the central positions C3, C4 for the speech stimuli (C3 > C4, see Table 4). Exemplarily, cortical responses to Dieb and DiebN across the entire scalp are depicted in Fig. (4), in order to illustrate the hemispheric asymmetries of the speech evoked potentials.
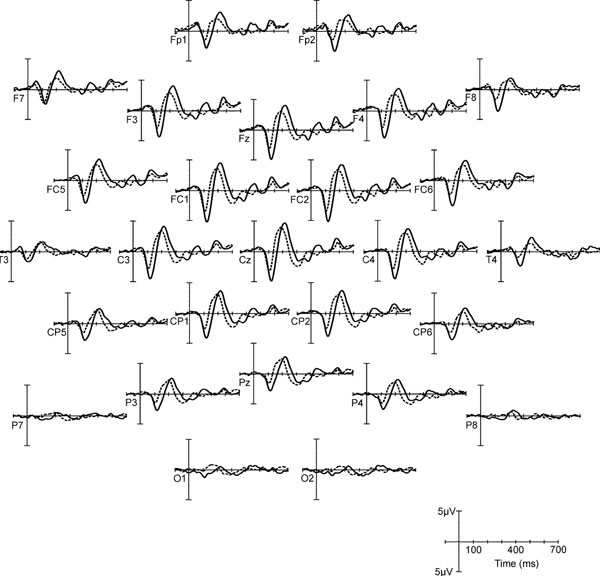
Grand mean AEPs to Dieb (solid) and DiebN (dashed) over the entire scalp.
N1-P2 Interpeak Amplitudes (in µV) and t Values for the Comparison of Selected Electrode Pairs (T3-T4, FC5-FC6, C3-C4)
Standard deviations are in parentheses.
n.s not significant,
* p<0.05,
** p<0.01,
*** p<0.001.
3.2. Speech-Noise Pairs
The AEP waveforms, in response to the speech sounds, were compared to those in response to the corresponding noise sounds. The time intervals, in which speech and corresponding noise responses significantly differed, are depicted in Fig. (5). Blocks of black colour mark temporal areas of significant differences (p<0.01) for each subject and each speech-noise pair. None of the speech-noise pair responses differs strongly during the initial 50 ms, as one can see from Figs. (5a-5d). The highest accumulations of areas of significant differences occur in the time window of 100 – 300 ms after stimulus onset.
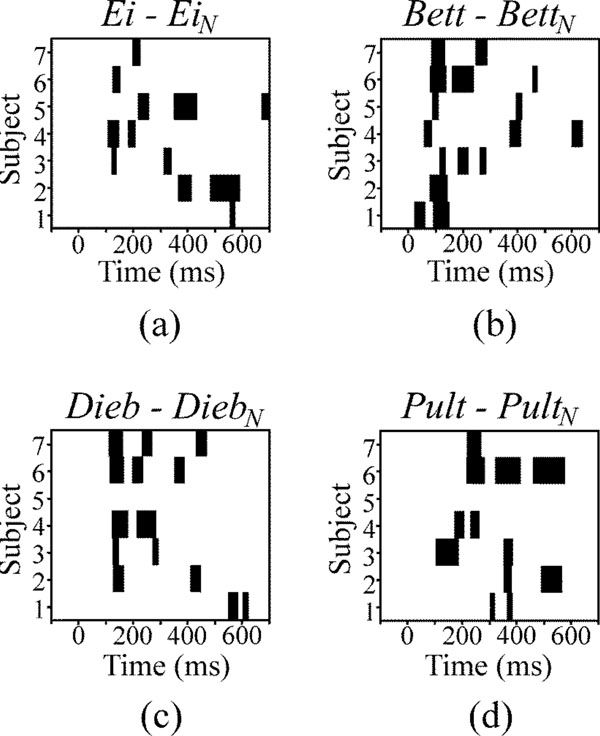
Temporal areas of significant differences between the responses to speech and noise stimuli at channel Cz for each subject (black areas). Level of significance is p<0.01.
Fig. (6) shows the grand mean AEP waveforms of the speech (dashed lines) and noise stimuli (dotted lines) as well as the difference signals (solid lines) speech – noise. In the difference signal, a negative component could be observed in a latency range of approximately 140 ± 15 ms. For each speech-noise pair, one-tailed t-tests (subjects x channels) showed that the occurring negative component was significantly smaller than zero. Latencies and amplitudes of this negative component are given in Table 5. Ei elicits the smallest latency, latencies in response to Bett and Dieb are similar and Pult elicits the longest latency. Fig. (7) shows the VOT of the four speech stimuli plotted against the peak latency of the negative component in the difference signal. A prominent correlation of VOT and peak latency is observable. Spearman rank correlation analysis revealed that the latencies were significant positively correlated with VOT (r = 0.66, p < 0.01).
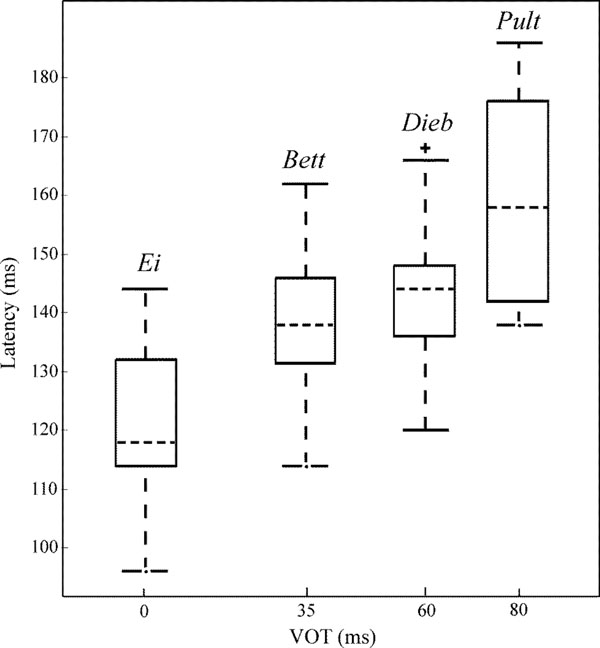
Box and whisker plot of VOTs of the diverse speech stimuli against the latencies of the negative components in the difference signal of the cortical responses. Dashed lines within the boxes display the median, the edges of the boxes display the quartiles. Whiskers indicate maximal and minimal latencies unless outliers ‘+’ occur (whiskers span 1.5 times the inter-quartile range).
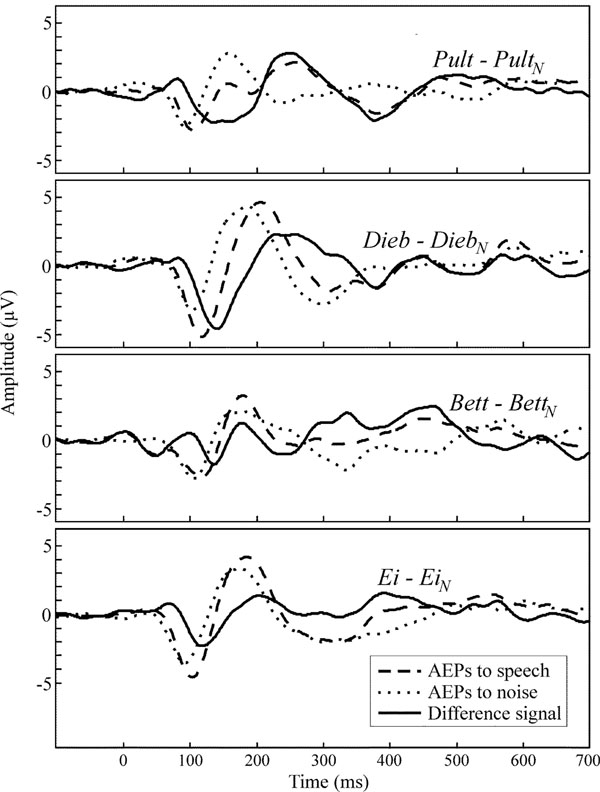
Grand mean waveforms at channel Cz of speech evoked responses (dashed), noise evoked responses (dotted) and the difference signal (solid).
Mean Latencies and Amplitudes of the Negative Component in the Difference Signal out of the Speech-Noise Pairs Averaged over all Channels
Standard deviations are in parentheses. Results of one-tailed t tests
*** p<0.001.
4. DISCUSSION
Generally, different natural speech stimuli evoke distinct neural response patterns [20]. The aim of this study was to show whether cortical response patterns to speech stimuli contain components due to one of the temporal features, the voice-onset time. For this purpose, AEP characteristics in response to monosyllabic words were compared against each other and with cortical responses to noise stimuli with the same temporal envelope as the speech stimuli.
4.1. Responses to Speech and Noise Stimuli
In accordance with other studies (e.g. [6, 20, 21]), for both types of stimuli, the AEPs were maximal at central electrode sites. The different natural speech stimuli evoked distinct neural response patterns, partially showing multiple overlapping responses. These distinctions indicate an extended neural activity with the auditory processing of speech in contrast to noise sound processing. Considering previous studies, a plausible explanation are the variant VOTs of the presented speech stimuli which affect the N1 and P2 [8, 13, 22, 23].
Winkler et al. demonstrated that N1 latencies evoked by spectral-pitch and missing-fundamental tones do not differ [24]. Hence, the different pitches of the presented vowels are probably not the reason for the found variability in the speech evoked potentials, at least not regarding the N1. An influence of the cortical response to the closing consonant on the P2 is not expectable due to its relatively late onset time.
4.2. Hemispheric Asymmetries
In contrast to noise elicited AEPs, hemispheric differences occurred with speech evoked AEPs in the present study. Hemispheric left-overbalanced asymmetries with speech perception are well known [25-27]. Left-overbalance is primarily reported in studies with attentive designs. However, focused auditory attention can selectively modulate automatic processing in auditory cortex and thus, affect AEPs [28].
Dehaene-Lambertz et al. demonstrated in a discrimination task that the left-hemispheric predominance with phoneme perception also can be achieved with appropriate non-speech stimuli [29]. Thus, specialization of left auditory cortex is not speech specific but depends on rapid spectrotemporal changes. However, in the present study, a right-hemispheric predominance was observable at temporal sites which inverted to a left-overbalance at central sites. This could be due to deviant locations in the activated auditory areas of both sides, resulting in different dipole orientations which underlie AEP derivations [30]. A more plausible explanation is a functional asymmetry of the auditory cortices. PET findings indicated complementary specializations of left and right auditory cortex’ belt areas [31]. Responses to temporal features were weighted towards the left, while responses to spectral features were weighted towards the right hemisphere.
Thus, the spectral changes of the consonant-vowel transitions may be the reason for the observed right hemispheric overbalance. In contrast, noise stimuli did not evoke asymmetric responses.
4.3. Speech-Noise Pairs
Although phonetic changes were present in the speech stimuli during the entire propagation of approximately 500 ms, AEPs of speech-noise pairs differed predominantly in the time window of the N1/P2 complex between 100 and 300 ms (Fig. 5), reflecting distinct onset processing.
Subtracting noise from speech elicited AEPs facilitated a direct comparison of the speech-noise pairs. Thus, the presented paradigm allows observing the neural processing of spectral-acoustic and phonetic information, since differences in stimulus duration and amplitude are eliminated. The comparison revealed a significant negative component in the difference signal that seems to correlate with the VOT of the presented stimulus (see Steinschneider et al. who found that synchronized activity in the auditory cortex is time locked with consonant release and voicing onset [32]). Since the speech evoked N1 and P2 appear somewhat later and heightened in contrast to the noise evoked, the present study suggests that the observed negative component denotes a second N1/P2 complex which is merged with the onset response. Therefore it is not directly visible. This second N1/P2 complex is suggested to reflect the onset of the vowel as an acoustic event.
This study demonstrated that rapid spectral changes in the perception of speech can be assessed electrophysiologically by means of a time-saving design. In case of modified cortical responses in subjects with central auditory processing disorders, this paradigm might serve as diagnostic tool for phonetic discrimination tasks since it reveals the neural processing of time-critical speech structures.
ACKNOWLEDGEMENTS
This work was supported by the grant from Deutsche Forschungsgemeinschaft DFG no. Ey 15/7-4 and ELAN no. PP-05.09.26.1.

