All published articles of this journal are available on ScienceDirect.
Correlation of Transcranial Color Doppler to N20 Somatosensory Evoked Potential Detects Ischemic Penumbra in Subarachnoid Hemorrhage
Abstract
Background:
Normal subjects present interhemispheric symmetry of middle cerebral artery (MCA) mean flow velocity and N20 cortical somatosensory evoked potential (SSEP). Subarachnoid haemorrhage (SAH) can modify this pattern, since high regional brain vascular resistances increase blood flow velocity, and impaired regional brain perfusion reduces N20 amplitude. The aim of the study is to investigate the variability of MCA resistances and N20 amplitude between hemispheres in SAH.
Methods:
Measurements of MCA blood flow velocity (vMCA) by transcranial color-Doppler and median nerve SSEP were bilaterally performed in sixteen patients. MCA vascular changes on the compromised hemisphere were calculated as a ratio of the reciprocal of mean flow velocity (1/vMCA) to contralateral value and correlated to the simultaneous variations of interhemispheric ratio of N20 amplitude, within each subject. Data were analysed with respect to neuroimaging of MCA supplied areas.
Results:
Both interhemispheric ratios of 1/vMCA and N20 amplitude were detected >0.65 (p <0,01) in patients without neuroimages of injury. Both ratios became <0.65 (p <0.01) when patients showed unilateral images of ischemic penumbra and returned >0.65 if penumbra disappeared. The two ratios no longer correlated after structural lesion developed, as N20 detected in the damaged side remained pathological (ratio <0.65), whereas 1/vMCA reverted to symmetric interhemispheric state (ratio >0.65), suggesting a luxury perfusion.
Conclusion:
Variations of interhemispheric ratios of MCA resistance and cortical N20 amplitude correlate closely in SAH and allow identification of the reversible ischemic penumbra threshold, when both ratios become <0.65. The correlation is lost when structural damage develops.
BACKGROUND
Both Middle Cerebral Artery (MCA) mean flow velocity measured by transcranial color Doppler (TCCD) and somatosensory evoked potential (SSEP) show high interhemispheric symmetry in normal subjects [1-4]. This condition could be modified after subarachnoid haemorrhage (SAH), due to prevalent unilateral alterations in vasoregulation of cerebral arteries and vasospasm [5, 6], resulting in impaired regional brain perfusion [7, 8]. The vessel section πr² (r = radius of the vessel) is inversely proportional to mean blood flow velocity V, and directly proportional to blood flow F (πr²= F/V). The variability in MCA vessel section resistances and blood flow, between hemispheres within one subject, can be evaluated by a semi quantitative approach, comparing the reciprocal of MCA mean blood flow velocities (1/vMCA) detected simultaneously on both sides, assuming the other determinants of F and V to be constant (F = ΔP∙πr²∙r²/8ηl, V = ΔP∙πr²/8ηl, ΔP = cerebral perfusion pressure, η = blood viscosity and l = length of measured segments of MCA). In addiction, there is strong correlation between variations of electrophysiological changes and regional cerebral blood flow (rCBF), and a 50% reduction in cortical SSEP amplitude at rCBF levels between 14 and 16 ml/100 g/min has been demonstrated [9]; for this reason cortical N20 SSEP from the median nerve has been widely used to evaluate cerebral function in carotid surgery and intracranial aneurysm operative procedures [10-12]. Mechanism, diagnosis and prevention of brain injury after SAH have been widely investigated [13-20], but evaluation of correlation between variations of cortical activity expressed by evoked potentials and regional brain vascular changes detected by transcranial color-Doppler is lacking. The aim of the study is to investigate the correlation between changes in resistances due to vessel section reduction of MCA and modifications of cortical SSEP by interhemispheric comparison of both values of 1/vMCA detected by TCCD and N20 amplitude, in a series of case studies of patients with SAH.
METHODS
Participants
We studied retrospectively sixteen patients (8 males and 8 females) consecutively admitted to Rovigo Hospital Intensive Care and Neurosurgery Department. Inclusion criteria and eligibility: ≥ 18 years old, diagnosis of spontaneous SAH by Digital Subtraction Angiography (DSA), absence of previous structural ischemic/haemorrhagic brain injury and stenosis of the neck and brain arteries. The average age was 54.4(SD = 14). Reported data gathered were: Glasgow Coma Score (GCS) on admission, aneurism site, Fisher score and surgery (Table 1).
Description of Patients
| Patient | sex | Age (mean ± S.D) | GCS on admission (mean ± S.D.) | Aneurism site | Fisher score | Surgery |
|---|---|---|---|---|---|---|
| 1 | m | 63 | 9 | Lt ACA | 4 | Clip |
| 2 | f | 57 | 7 | Rt PComA | 3 | Clip Craniectomy EVD |
| 3 | f | 68 | 8 | AComA | 4 | Clip Craniectomy EVD |
| 4 | f | 69 | 4 | Rt MCA | 4 | EVD |
| 5 | m | 32 | 8 | Rt MCA | 3 | Clip |
| 6 | f | 30 | 13 | No evidence | 2 | No surgery |
| 7 | f | 69 | 7 | Rt MCA | 3 | Clip |
| 8 | m | 41 | 5 | A ComA | 4 | Coil Clip Craniectomy EVD |
| 9 | m | 48 | 8 | A ComA | 3 | Clip Craniectomy |
| 10 | m | 52 | 9 | Lt MCA | 3 | Clip |
| 11 | m | 75 | 9 | Lt MCA | 4 | Clip Craniectomy |
| 12 | m | 45 | 6 | No evidence | 3 | EVD |
| 13 | m | 46 | 12 | ACA | 2 | No surgery |
| 14 | f | 49 | 12 | Rt MCA | 2 | Clip |
| 15 | f | 54 | 9 | Lt ICA | 2 | Clip Craniectomy EVD |
| 16 | m | 73 | 10 | Lt ACA | 2 | Clip |
| (54.4± 14) | (8.5 ± 2.4) |
Lt ACA = Left Anterior Cerebral Artery, Rt PcomA = Right Posterior Communicating Artery, A comA = Anterior Communicating Artery, Rt MCA = Right Middle Cerebral Artery, Lt MCA = Left Middle Cerebral Artery, Lt ICA = Left internal Carotid Artery, EVD = External Ventricular Drainage.
Procedures and Examination Timing
All patients were submitted to neuroimaging, SSEP and TCCD investigations along their Intensive Care Unit stay. SAH diagnosis was made by DSA and/or Computed Tomographic angiography (CTA). Subsequently, patients were evaluated with Computed Axial Tomography (CT), CTA, Magnetic Resonance Imaging (MRI) or Magnetic Resonance angiography (MRA) twelve hours after surgery and when needed on a clinical evaluation basis. Timing of first examination after SAH diagnosis of each patient (neuroimaging and simultaneous SSEP and TCCD) is showed in Table 2 and subsequent examinations in Table 3 (in the column ‘day of examin. after SAH diagnosis’). SSEP by median nerve and TCCD of MCA were performed bilaterally on each patient. Preferably bilateral SSEP and TCCD should be performed simultaneously during each examination. As this was not possible, we conducted sequential recording of SSEP and TCCD in a very close temporal succession, of no longer than thirty minutes. They were considered as simultaneously recorded if the clinical conditions, monitored respiratory and hemodynamic parameters and infusion therapy were unchanged during examination. Each patient was examined several times on different days throughout the survey. Thirteen patients were examined after surgery; one patient before and after; two did not undergo surgery during our observation. Four patients were awake during examinations. Twelve were under mechanical ventilation and sedated with a remifentanil and propofol infusion. A normal range of arterial oxygenation (oxygen arterial partial pressure > 100 mmHg), normocapnia (carbon dioxide arterial partial pressure between 35 and 40 mmHg), mean arterial pressure above 70 mmHg and haemoglobin value higher than 10 g/dl were maintained; intracranial pressure (ICP) and CPP were monitored in 7 patients only. We briefly suspended hypnotics infusion to perform the clinical evaluation of the patients after each examination.
Examination Timing
| Patient | Day of First Examination (simultaneous SSEP and TCCD and Neuroimaging) after SAH diagnosis (mean ± S.D) | Days of observation (mean ± S.D) | Total Number of simultaneous examinations performed during I.C.U. stay (mean ± S.D) |
|---|---|---|---|
| 1 | 7 | 1 | 1 |
| 2 | 3 | 23 | 9 |
| 3 | 3 | 43 | 9 |
| 4 | 6 | 1 | 1 |
| 5 | 2 | 28 | 7 |
| 6 | 1 | 3 | 2 |
| 7 | 3 | 7 | 3 |
| 8 | 1 | 2 | 2 |
| 9 | 4 | 25 | 6 |
| 10 | 1 | 10 | 2 |
| 11 | 1 | 7 | 4 |
| 12 | 1 | 14 | 6 |
| 13 | 3 | 5 | 3 |
| 14 | 1 | 7 | 3 |
| 15 | 1 | 16 | 6 |
| 16 | 3 | 3 | 2 |
| (2.5 ± 1.8) | 12.1 ± 11.9 | 4.1± 2.6 |
Variations of N20 Amplitude and Reciprocal of MCA Mean Flow Velocity (1/vMCA) Detected on the Compromised Hemisphere Expressed as a Ratio of Contralateral Values, Compared to CT-MRI Scan Image of Corresponding MCA Brain Area, N20 Amplitude Absolute Value, Vasospasm and Lateralizing Symptoms
| Patient | Exam | Day of examin. after SAH diagnosis | N20 ratio | 1/vMCA ratio | CT/MRI | N20 ampl. (µV) | Vasospasm | Symptoms |
|---|---|---|---|---|---|---|---|---|
| 1 | 1 | 7 | 0.913 | 0.891 | 0 | 0 (2.28) | 0 | 0 |
| 2 | 2 | 3 | 0.458 | 0.426 | 1 | 1 (1.06) | 1 | 1 |
| 2 | 3 | 4 | 0.384 | 0.456 | 1 | 1 (0.88) | 1 | 1 |
| 2 | 4 | 5 | 0.336 | 0.472 | 1 | 1 (1.11) | 1 | 1 |
| 2 | 5 | 6 | 0.485 | 0.877 | 2 | 0 (1.5) | 1 | 1 |
| 2 | 6 | 7 | 0.58 | 0.711 | 2 | 1 (1.22) | 0 | 1 |
| 2 | 7 | 8 | 0.478 | 0.915 | 2 | 1 (0.96) | 2 | 1 |
| 2 | 8 | 14 | 0.65 | 0.756 | 2 | 1 (1.12) | 0 | 1 |
| 2 | 9 | 20 | 0.541 | 0.816 | # | 0 (1.32) | 0 | 1 |
| 2 | 10 | 26 | 0.41 | 0.832 | # | 0 (1.27) | 0 | 1 |
| 3 | 11 | 3 | 0.599 | 0.52 | 1 | 0 (1.98) | 0 | 1 |
| 3 | 12 | 6 | 0.837 | 0.885 | 0 | 0 (2.39) | 0 | 0 |
| 3 | 13 | 8 | 0.728 | 0.767 | 0 | 0 (2.16) | 0 | 0 |
| 3 | 14 | 22 | 0.814 | 0.849 | # | 0 (2.39) | 0 | 0 |
| 3 | 15 | 23 | 0.828 | 0.851 | # | 0 (2.13) | 0 | 0 |
| 3 | 16 | 27 | 0.982 | 0.921 | # | 0 (1.66) | 0 | 0 |
| 3 | 17 | 30 | 0.871 | 0.923 | # | 0 (2.44) | 0 | 0 |
| 3 | 18 | 36 | 0.981 | 0.992 | 0 | 0 (1.35) | 0 | 0 |
| 3 | 19 | 46 | 1.115 | 1.008 | # | 0 (2.26) | 0 | 0 |
| 4 | 20 | 6 | 0.51 | 0.9 | 2 | 1 (1.19) | 0 | 1 |
| 5 | 21 | 2 | 0.61 | 0.566 | 1 | 0 (2.86) | 0 | 1 |
| 5 | 22 | 7 | 0.474 | 0.537 | 1 | 0 (3.44) | 1 | 1 |
| 5 | 23 | 8 | 0.475 | 0.495 | 1 | 0 (4.44) | 1 | 1 |
| 5 | 24 | 10 | 0.499 | 0.448 | 1 | 0 (4.26) | 1 | 1 |
| 5 | 25 | 12 | 0.549 | 0.513 | 1 | 0 (4.76) | 0 | 1 |
| 5 | 26 | 14 | 0.568 | 0.592 | # | 0 (3.22) | 0 | 1 |
| 5 | 27 | 30 | 0.847 | 0.816 | 0 | 0 (4.42) | 0 | 0 |
| 6 | 28 | 1 | 0.747 | 0.853 | 0 | 0 (1.61) | 0 | 0 |
| 6 | 29 | 3 | 0.83 | 0.869 | # | 0 (1.29) | 0 | 0 |
| 7 | 30 | 3 | 0.707 | 0.833 | # | 0 (3.59) | 0 | 0 |
| 7 | 31 | 4 | 0.701 | 0.716 | # | 0 (3.67) | 0 | 0 |
| 7 | 32 | 10 | 0.529 | 0.591 | 3 | 0 (4.9) | 0 | 1 |
| 8 | 33 | 1 | 0.482 | 0.659 | 2 | 1 (<0.5) | 0 | 1 |
| 8 | 34 | 2 | 0 | 0.725 | 2 | 1 (<0.5) | 1 | 1 |
| 9 | 35 | 4 | 0.893 | 0.971 | 0 | 0 (1.5) | 1 | 0 |
| 9 | 36 | 5 | 1.098 | 1.097 | # | 0 (2) | 2 | 0 |
| 9 | 37 | 7 | 0.943 | 0.971 | # | 0 (2.15) | 0 | 0 |
| 9 | 38 | 8 | 1.158 | 1.188 | # | 0 (1.95) | 2 | 0 |
| 9 | 39 | 10 | 0.943 | 0.945 | # | 0 (1.42) | 2 | 0 |
| 9 | 40 | 12 | 0.972 | 0.957 | # | 0 (1.74) | 1 | 0 |
| 10 | 41 | 1 | 0.986 | 0.954 | 0 | 0 (2.15) | 0 | 0 |
| 10 | 42 | 10 | 1 | 1 | # | 0 (4.7) | 0 | 0 |
| 11 | 43 | 1 | 0.3 | 1.15 | 2 | 1 (<0.5) | 0 | 1 |
| 11 | 44 | 2 | 0.3 | 0.75 | 2 | 1 (<0.5) | 0 | 1 |
| 11 | 45 | 3 | 0 | 0.824 | 2 | 1 (<0.5) | 0 | 1 |
| 11 | 46 | 7 | 0 | 1.01 | # | 1 (<0.5) | 0 | 1 |
| 12 | 47 | 1 | 0.756 | 0.776 | 3 | 0 (2.57) | 0 | 1 |
| 12 | 48 | 4 | 0.49 | 0.516 | 1 | 0 (1.5) | 1 | 1 |
| 12 | 49 | 6 | 0.662 | 0.799 | # | 0 (2.81) | 1 | 0 |
| 12 | 50 | 7 | 0.714 | 0.704 | # | 0 (4.26) | 1 | 1 |
| 12 | 51 | 10 | 0.913 | 0.919 | # | 0 (5.7) | 2 | 0 |
| 12 | 52 | 14 | 0.884 | 1.026 | 0 | 0 (4.21) | 0 | 0 |
| 13 | 53 | 3 | 0.854 | 0.827 | 0 | 0 (2.93) | 2 | 0 |
| 13 | 54 | 5 | 0.744 | 0.907 | # | 0 (2.44) | 1 | 0 |
| 13 | 55 | 7 | 0.777 | 0.856 | # | 0 (2.13) | 2 | 0 |
| 14 | 56 | 1 | 0.959 | 0.876 | 0 | 0 (1.97) | 2 | 0 |
| 14 | 57 | 3 | 1.268 | 1.036 | 0 | 0 (2.6) | 0 | 0 |
| 14 | 58 | 7 | 0.93 | 1.01 | # | 0 (1.81) | 2 | 0 |
| 15 | 59 | 1 | 0.789 | 0.716 | 0 | 0 (3.22) | 0 | 0 |
| 15 | 60 | 2 | 0.557 | 0.64 | 1 | 0 (2.78) | 1 | 1 |
| 15 | 61 | 3 | 0.309 | 0.467 | 1 | 0 (1.56) | 0 | 1 |
| 15 | 62 | 4 | 0.7 | 0.673 | 0 | 0 (3.74) | 0 | 0 |
| 15 | 63 | 5 | 0.718 | 0.666 | 0 | 0 (4.13) | 0 | 0 |
| 15 | 64 | 16 | 0.916 | 0.905 | 0 | 0 (4.0) | 0 | 0 |
| 16 | 65 | 3 | 0.715 | 0.666 | 0 | 0 (2.42) | 0 | 0 |
| 16 | 66 | 6 | 0.639 | 0.622 | 1 | 0 (2.0) | 0 | 1 |
CT/MRI: MCA area alterations image: 0 = no alterations, 1 = transient and reversible lesions (oedema, hypodensity), 2 = structural damage (ischemia, hematoma), 3 = hydrocephalus, # = missing. N20 amp : N20 amplitude on the compromised hemisphere : 0 = N20 amplitude > 1,2 µV, 1 = N20 amplitude < 1,2 µV. Vasospasm : 0 = absence, 1 = monolateral, 2 = bilateral. Symptoms : 0 = absence, 1 = presence (arm paresis, hemiparesis, hemiplegia or/and consciousness alteration).
SSEP
A Nicolet Viking Four Electrodiagnostic System, with four channel amplifier and isolated electrical stimulator, was used to obtain the evoked potentials. Surface stimulating electrodes and steel needle subcutaneous electrodes were used for recording. Recording electrodes were positioned on Erb’s point, cervical spine (C7) with reference to antecollis, cortical C3’ and C4’ (2 cm posterior to C3 and C4, international 10-20 system) and ipsilateral mastoid with reference to Fz. SSEP stimulation parameters were 10-20 mA intensity (4-6 mA above visible thumb twitching threshold), 0.2 ms duration and 4.1 Hz square wave. Sweep time was at 100 ms, sensitivity at 2 μV/div; filters were set at 30 and 3000 Hz. For each recording condition, two runs of 300 and 250 responses were averaged, and checked for reproducibility, without artefacts, and superimposed. Latency and amplitude of N9, N13, P14 and N20 were recorded and measured during the first examination; subsequently only N9 and N20 waves were recorded. Peaks were indicated with cursors on the screen, placed manually; peak-latencies and peak-to-peak amplitudes were calculated on the first trace. Normal value of N20 amplitude was fixed at 1.2 μV, as indicated by Amantini [21], using the same reference (Fz).
TCCD
Vivid 3 Expert General Electric Ultrasound Unit, equipped with 1,8-2,5 MHz 90° phased-array probe for both B-mode and colour Doppler imaging was used to perform TCCD examinations. Intracranial cerebral arteries were examined bilaterally through the acoustic window in the temporal squama, and, if present, through the craniectomy window. The M1 segment of MCA was identified with colour imaging; a 2 to 6 mm wide sample volume was placed on the colour image of the artery at the site of the highest flow acceleration. The angle of insonation was corrected by visual guidance, orientating a linear marker provided with the scanner along the long axis of the segment. The same wide sample volume was set and used during each bilateral examination. Mean flow velocity was calculated with automatic tracing and manual tracing in case of a wake signal. Bilateral mean flow velocity of the internal carotid artery at the angle of the inferior mandible was recorded, to determine the Lindegaard Index. Vasospasm was assumed when mean flow velocity reached 120 cm/sec in M1 segment of MCA [22] and Lindegaard Index > 3 [23].
Data Evaluation
All examinations and measurements were performed by the same anaesthesiologist, with more than ten years of experience in critical care, five years in evoked potentials in Intensive Care Unit and two years in transcranial color-Doppler. Comparison between hemispheres, within each patient, of both 1/v MCA and N20 amplitude was made in each examination and values recorded on the compromised hemisphere were expressed as a ratio of the contralateral values. Correlation of 1/vMCA to N20 interhemispheric ratio was calculated. In addition, N20 absolute value and presence/absence of vasospasm and neurological symptoms such as drowsiness, consciousness modifications and hemiparesis/hemiplegia were evaluated; other identifiable causes of neurological worsening such as serum electrolyte or glucose disturbances, hypoxia, hypercapnia, or seizures (clinical or electrographic) were excluded. All data were analyzed with respect to Brain CT or MRI executed on same day as TCCD and SSEP examination. We considered images of transient and reversible alterations (oedema, hypodensity) or structural damage (ischemia, infarction, haemorrhage) shown in the brain area supplied by MCA; hydrocephalus treated by external ventricular drainage (EVD) has been considered as reversible alteration.
Statistical Analysis
Mean and percentage were used for descriptive purposes. Statistical significance was defined as p< 0.01. Pearson Coefficient Correlation (r), with respective confidence interval at 95% (95%CI), was used to determine quantitative variables. SAS and SPSS (Statistical Analysis System, Software Products for Statistical Solution) were used for statistical analysis.
RESULTS
During the survey all 16 patients were eligible. A total of 66 bilateral SSEP and TCCD were performed with the criteria of simultaneousness. Values of the 1/v MCA and N20 amplitude recorded on the compromised hemisphere of each patient, expressed as ratios of their respective contralaterals and compared to CT/MRI scan images of the corresponding MCA supplied area, N20 amplitude absolute value, presence/absence of vasospasm and lateralizing symptoms are shown in Tab.3. The 1/vMCA and N20 interhemispheric ratio of 40 examinations were analyzed in respect of 40 images of CT/MRI scan performed on the same day as the TCCD and SSEP. Sixteen examinations in eleven patients (group 1: patients No. 1,3,5,6,9,10,12,13,14,15,16) matched CT/MRI image of no brain damage in the area supplied by the MCA: all subjects showed a high level of symmetry between interhemispheric values of 1/vMCA and N20 amplitude (Fig. 1); both interside ratios were always >0,65 and showed correlation (p< 0,01, r = 078, 95% CI = 0,46 to 0,92). In this group, MCA unilateral vasospasm (mean flow velocity > 120 < 150 cm /sec, L.I.>3) or almost symmetric bilateral vasospasm (< 180 cm/sec, L.I.>3) was detected in 18,7% of examinations; N20 amplitudes were still bilaterally normal (>1,2 μV) and symmetric. Patients did not show lateralizing neurological defects or consciousness alteration at clinical evaluation (Table 4). Fourteen examinations in seven patients (group 2: patients No. 2,3,5,7,12,15,16) matched CT/MRI images of tissue alterations in unilateral MCA area (shift, oedema, tissue hypodensity, cloth) or hydrocephalus. Both values of 1/vMCA and N20 amplitude on the compromised side were lower than contralateral and both interhemi-spheric ratios were always <0,65 in all these patients (p <0,01 r = 0,67, 95% CI = 0,23 to 0,88) (Fig. 2). Unilateral MCA vasospasm (mean flow velocity > 120 < 180 cm/sec and L.I. >3) was detected in 57% of overall examinations. N20 amplitudes on the compromised hemisphere were much lower than those on the contralateral in all patients, but still > 1,2 μV, except in patient No.2, who reached pathological amplitude (<1,2 μV) in several examinations. Corresponding lateralizing neurological defect of muscular strength or conciousness alteration was detected at clinical examination in all these patients (Table 5). Ten examinations in four patients (group 3: patients No.2,4,8,11) matched unilateral CT/MRI brain structural ischemic or hemorrhagic damage evidence; in all of them, resistance (1/vMCA) on the compromised side reverted to a high ratio to the contralateral (>0,65) and no longer correlated to the persistent interhemispheric asymmetry of N20 amplitude (ratio < 0,65) (Fig. 3); in this group correlation between the interhemispheric ratios of 1/MCA and N20 was lost (p=0.88, r = -0.05, 95% CI = -0.66 to 0.59). MCA vasospasm (mean flow velocity > 120< 165 cm /sec) was detected in 33,3% of examinations. The N20 value on the compromised hemispheres was pathologic (<1,2 μV) or absent in 9 examinations and all patients had stable hemiparesis or hemiplegia (Table 6). Patients No. 2, 3,5,12,15 belong to more than one group at different times, as a consequence of modification of their brain CT/MRI images during the survey; patient No.2 shifted from group 2 to 3; patients No. 3 and No.5 shifted from group 2 to 1; patients No.12 and No.15 shifted from group 1 to 2 and back to 1 again. In addition, we examined the course and correlation between the two interhemispheric ratios in those patients, seven in all, who were submitted to more than three examinations on different days. Statistic correlation (p<0.01) emerged in patient No. 9 (Fig. 4), who had no CT modifications and in those who showed transient unilateral alterations on CT/MRI in MCA supplied brain area and resumed a normal picture (patients No. 3, 5,12,15; Figs. 5-8). Interhemispheric modifications of 1/vMCA and N20 amplitude did not correlate in patients who had morphological brain damage on CT scan immediately after SAH (patient No.11, p = 0.89) (Fig. 9) or who subsequently developed brain injury (patient No.2, p = 0.2) (Fig. 10a,b).
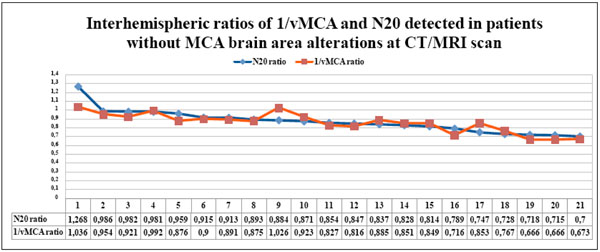
The couples of N20 and 1/vMCA interhemispheric ratio values, detected in each patient without CT/MRI scan alterations in the MCA supplied area, gathered in Table 4, are displayed in the graph in descending order. All N20 and 1/vMCA interhemispheric ratio values were >0.65 and showed significant statistical correlation ( p < 0.01, r = 0.78, 95% C.I. = 0.46 to 0.92).
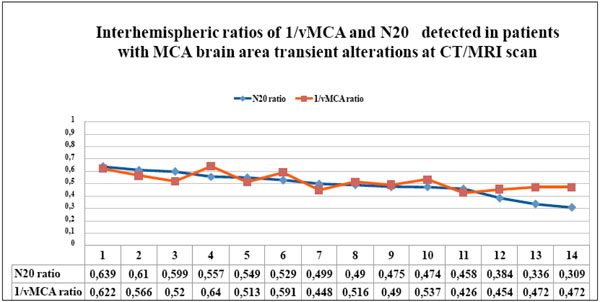
The couples of N20 and 1/vMCA interhemispheric ratio values, detected in each patient with CT/MRI scan unilateral transient alterations in the MCA supplied area, gathered in table 5, are displayed in the graph in descending order. All N20 and 1/vMCA interhemispheric ratio values were < 0.65 and showed significant statistic correlation (p < 0.01, r = 0.67, 95% C.I. = 0.23 to 0.88).
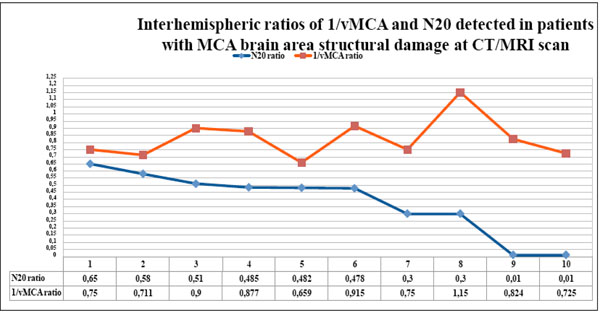
The couples of N20 and 1/vMCA interhemispheric ratio values detected in each patient with CT/MRI scan unilateral structural ischemic or hemorrhagic alterations in the MCA supplied area, gathered in table 6, are displayed in the graph in descending order of N20 ratio values . The two ratios show divergent courses, since the value of N20 on the compromised hemisphere is < 0.65 with respect to the contralateral, whereas the 1/vMCA value reverts to ratio >0.65. The two ratios no longer correlate in this group ( p = 0.88, r = -0.05, 95% C.I.= - 0.66 to 0.59).
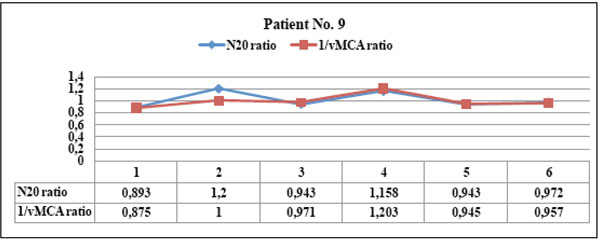
Patient No. 9 showed parallel courses of N20 and 1/vMCA interhemispheric ratios ( always > 0.65), with significant statistical correlation ( p <0.01, r = 0.94, C.I. 0.57 to 0.99). This patient never developed CT/MRI scan alteration of MCA area. He showed transient vasospasm, even bilateral, (BFV >120 < 240), normal N20 amplitude and was always asymptomatic during the survey.
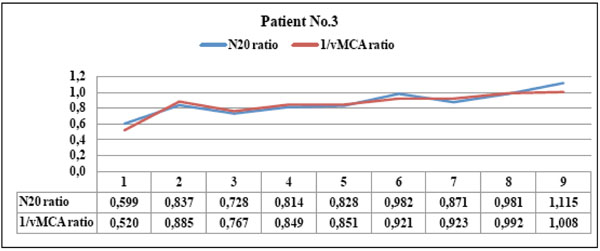
Patient No. 3 showed parallel courses of N20 and 1/vMCA interhemispheric ratios with significant statistical correlation ( p < 0.01, r =0.91, C.I. 0.64 to 0.98). The patient showed TC scan image of parietal oedema corresponding to both ratio values <0.65 in the first examination (point 1); this promptly recovered to ratio values >0.65 after oedema disappeared (point 2). This patient never reached the vasospasm threshold, always maintained N20 amplitude > 1,2 µV on the compromised hemisphere and showed clinical evidence of lateralizing strength deficit with respect to the first examination only (point 1).
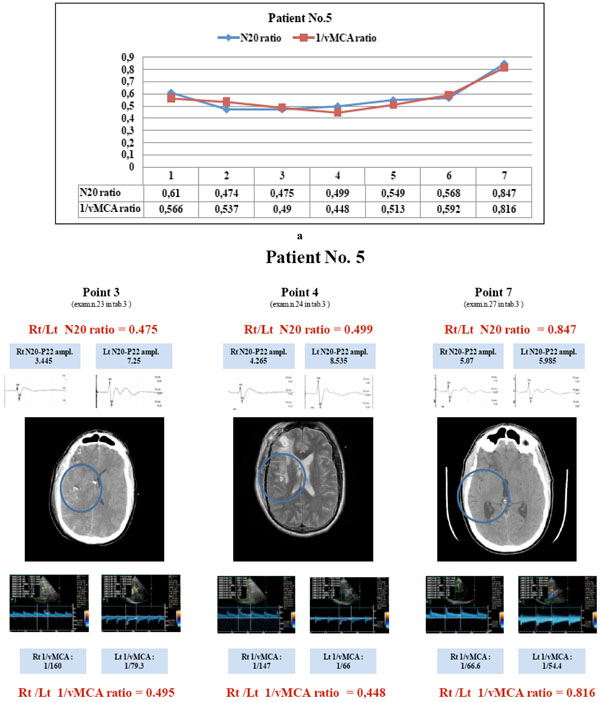
Patient No. 5: the courses of N20 and 1/vMCA ratios correlate (p < 0.01, r = 0.94, C.I. 0.65 to 0.99). He showed both ratios < 0.65 correspondig to points 1 to 6 (a) and and CT/MRI images of parietal oedema or hypodensity (b, points 3 and 4); the last couple of values > 0.65 (a, point 7) correspond with a re-established normal CT scan (b, point 7). He had vasospasm (BFV >120 <180) corresponding to points 2,3 and 4; he always maintained N20 absolute value > 1,2 µV on the compromised hemisphere; when both ratios reached a value < 0.65 (points 2 to 6), he showed lateralizing symptoms and/or consciousness modification; when both ratios reverted to a value > 0.65 (point 7) he recovered to a normal clinical condition. (N20 amplitude is expressed in µV and MCA blood flow velocity in cm/sec).

Patient No. 12 showed parallel courses of N20 and 1/vMCA ratios (p <0.01, r = 0.92, C.I. = 0.44 to 0.99). He showed hydrocephalus promptly treated with EVD (point 1) and right parietal oedema (point 2) in MCA area at CT scan (both ratios < 0.65). He maintained N20 amplitude > 1.2 µV on the compromised hemisphere and vasospasm (BFV >120 to 180 cm/sec) was detected corresponding to points 2,3,4,5; the patient had clinical transient lateralizing symptoms corresponding to point 2 and recovered a normal clinical picture in subsequent examinations (points 3 to 6); CT scan performed at point 6 was normal (both ratios > 0.65).
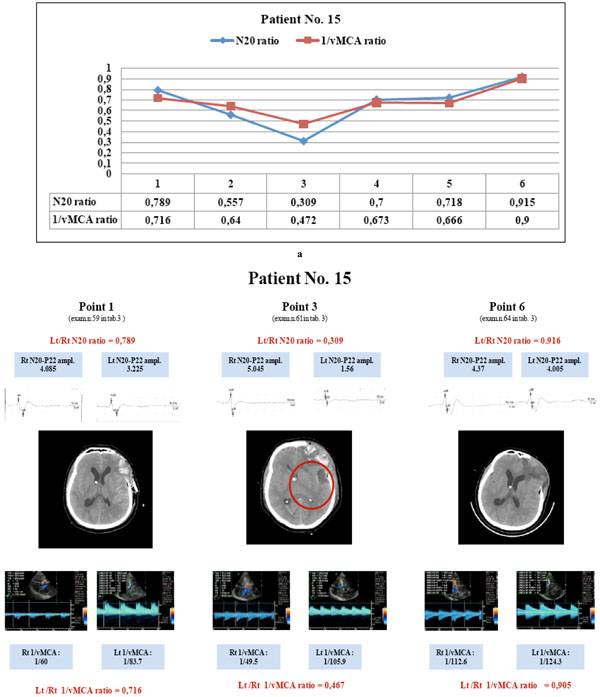
Patient No. 15: the parallel variations of N20 and 1/vMCA ratio (a) show a statistically significant correlation (p < 0.01, r = 0.94, C.I. 0.58 to 0.99); at first examination both ratio values > 0.65 (a, point 1) corresponded with normal MCA supplied brain area at CT scan (b, point 1); later modifications of both ratios to values < 0.65 (a, points 2,3) corresponded with the appearance of an image of parietal hypodensity at CT scan (b, point 3); the following ratio values > 0.65 corresponded to normalized CT scan (b, point 6). This patient had vasospasm at point 2 (BFV >180<200 cm/sec), had constant > 1.2 µV N20 amplitude, and showed lateralizing symptoms and/or consciousness modification at points 2 and 3 (ratios < 0.65). (N20 amplitude is expressed in µV and MCA blood flow velocity in cm/sec).
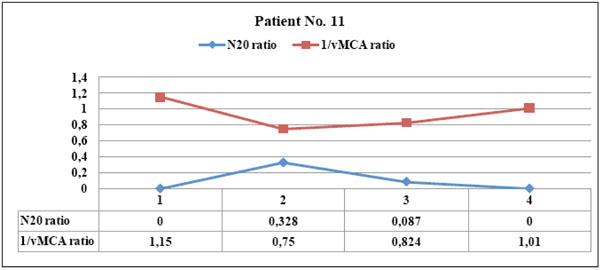
This patient showed left parietal hemorrhagic damage evident at CT scan immediately after SAH: the courses of N20 and 1/vMCA ratios were divergent and did not correlate (p = 0.89), since N20 had pathologic amplitude < 1.2 µV at point 1 and 2 and disappeared in subsequent examinations, whereas 1/vMCA was always almost symmetric on hemispheres. The patient never had vasospasm and clinical stable hemiparesis was evident.
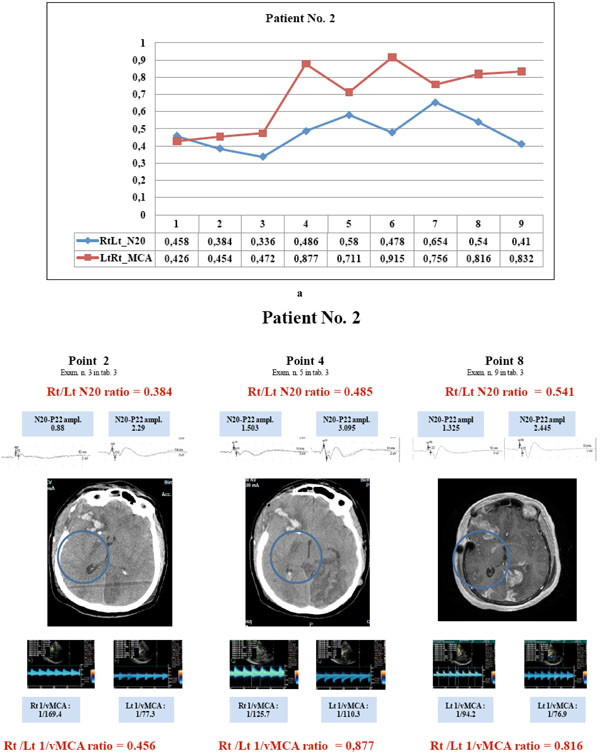
Patient No. 2 showed parallel courses of very low N20 and 1/v MCA ratio (<0.65) detected in the first three examinations (a, points 1to 3), corresponding with CT image of hypodesity of the right capsula (b, point 2); in the subsequent examinations, the divergent courses of N20 (< 0.65) and 1/vMCA (>0.65) and non correlated ratios (p= 0.2 r = 0.46, C.I. for r : -0.28 to 0.86) corresponded with CT and MRI images of structural infarct in the same area (b, point 4 and 8). Right N20 amplitude was < 1.2µV at points 1to 3 and 6 to7 (see examinations 2,3,4,7,8 in Table 3) and =< 1.5 µV at points 4,5, 8and 9 (see examinations 5,6,9,10 in Table 3); right MCA vasospasm (BFV >120 <180 cm/sec) was detected at points 1to 6. Clinical hemiparesis was always evident. (N20 amplitude is expressed in µV and MCA blood flow velocity in cm/sec).
Sixteen Examinations in Eleven Patients (Group 1: Patients No. 1,3,5, 6,9,10, 12,13,14,15,16) Matched CT/MRI Image of no Brain Damage in the Area Supplied by the MCA
| Patient | Exam | N20 ratio | 1/vMCA ratio | CT/MRI | N20_amp | Vasospasm | Symptoms |
|---|---|---|---|---|---|---|---|
| 1 | 1 | 0.913 | 0.891 | 0 | 0 | 0 | 0 |
| 3 | 12 | 0.837 | 0.885 | 0 | 0 | 0 | 0 |
| 3 | 13 | 0.728 | 0.767 | 0 | 0 | 0 | 0 |
| 3 | 18 | 0.981 | 0.992 | 0 | 0 | 0 | 0 |
| 5 | 27 | 0.847 | 0.816 | 0 | 0 | 0 | 0 |
| 6 | 28 | 0.747 | 0.853 | 0 | 0 | 0 | 0 |
| 9 | 35 | 0.893 | 0.971 | 0 | 0 | 1 | 0 |
| 10 | 41 | 0.986 | 0.954 | 0 | 0 | 0 | 0 |
| 12 | 52 | 0.884 | 1.026 | 0 | 0 | 0 | 0 |
| 13 | 53 | 0.854 | 0.827 | 0 | 0 | 2 | 0 |
| 14 | 56 | 0.959 | 0.876 | 0 | 0 | 2 | 0 |
| 14 | 57 | 1.268 | 1.036 | 0 | 0 | 0 | 0 |
| 15 | 59 | 0.789 | 0.716 | 0 | 0 | 0 | 0 |
| 15 | 63 | 0.718 | 0.666 | 0 | 0 | 0 | 0 |
| 15 | 64 | 0.916 | 0.905 | 0 | 0 | 0 | 0 |
| 16 | 65 | 0.715 | 0.666 | 0 | 0 | 0 | 0 |
CT/MRI: MCA area alterations image 0 = no alterations, 1 = transient and reversible lesions (oedema, hypodensity), 2 = structural damage (ischemia, hematoma), 3 = hydrocephalus. N20 amp : 0 = N20 amplitude > 1,2 µV, 1 = N20 amplitude < 1,2 µV. Vasospasm : 0 = absence, 1 = monolateral, 2 = bilateral. Symptoms : 0 = absence, 1 = presence (arm paresis, hemiparesis, hemiplegia or/and consciousness alterations).
Fourteen Examinations in Seven Patients (Group 2: Patients No. 2,3,5,7, 12,15,16) Matched CT/MRI Images of Tissue Alterations in Unilateral MCA Area (Shift, Oedema, Tissue Hypodensity, Clot) or Hydrocephalus
| Patient | Exam | N20 ratio | 1/vMCA ratio | CT/MRI | N20_amp | Vasospasm | Symptoms |
|---|---|---|---|---|---|---|---|
| 2 | 2 | 0.458 | 0.426 | 1 | 1 | 1 | 1 |
| 2 | 3 | 0.384 | 0.456 | 1 | 1 | 1 | 1 |
| 2 | 4 | 0.336 | 0.472 | 1 | 1 | 1 | 1 |
| 3 | 11 | 0.599 | 0.52 | 1 | 0 | 0 | 1 |
| 5 | 21 | 0.61 | 0.566 | 1 | 0 | 0 | 1 |
| 5 | 22 | 0.474 | 0.537 | 1 | 0 | 1 | 1 |
| 5 | 23 | 0.475 | 0.495 | 1 | 0 | 1 | 1 |
| 5 | 24 | 0.499 | 0.448 | 1 | 0 | 1 | 1 |
| 5 | 25 | 0.549 | 0.513 | 1 | 0 | 0 | 1 |
| 7 | 32 | 0.529 | 0.591 | 3 | 0 | 0 | 1 |
| 12 | 48 | 0.49 | 0.516 | 1 | 0 | 1 | 1 |
| 15 | 60 | 0.557 | 0.64 | 1 | 0 | 1 | 1 |
| 15 | 61 | 0.309 | 0.467 | 1 | 0 | 0 | 1 |
| 16 | 66 | 0.639 | 0.622 | 1 | 0 | 0 | 1 |
CT/MRI: MCA area alterations image 0 = no alterations, 1 = transient and reversible lesions (oedema, hypodensity), 2 = structural damage (ischemia, hematoma), 3 = hydrocephalus. N20 amp : 0 = N20 amplitude > 1,2 µV, 1 = N20 amplitude < 1,2 µV. Vasospasm : 0 = absence, 1 = monolateral, 2 = bilateral. Symptoms : 0 = absence, 1 = presence (arm paresis, hemiparesis, hemiplegia or/and consciousness alterations).
Ten Examinations in Four Patients (Group 3: No. 2,4,8,11) Matched Unilateral CT/MRI Brain Structural Ischemic or Hemorrhagic Damage Evidence
| Patient | Exam | N20 ratio | 1/vMCA ratio | CT/MRI | N20_amp | Vasospasm | Symptoms |
|---|---|---|---|---|---|---|---|
| 2 | 5 | 0.485 | 0.877 | 2 | 0 | 1 | 1 |
| 2 | 6 | 0.58 | 0.711 | 2 | 1 | 0 | 1 |
| 2 | 7 | 0.478 | 0.915 | 2 | 1 | 2 | 1 |
| 2 | 8 | 0.65 | 0.756 | 2 | 1 | 0 | 1 |
| 4 | 20 | 0.51 | 0.9 | 2 | 1 | 0 | 1 |
| 8 | 33 | 0.482 | 0.659 | 2 | 1 | 0 | 1 |
| 8 | 34 | 0 | 0.725 | 2 | 1 | 1 | 1 |
| 11 | 43 | 0.3 | 1.15 | 2 | 1 | 0 | 1 |
| 11 | 44 | 0.3 | 0.75 | 2 | 1 | 0 | 1 |
| 11 | 45 | 0 | 0.824 | 2 | 1 | 0 | 1 |
CT/MRI: MCA area alterations image 0 = no alterations, 1 = transient and reversible lesions (oedema, hypodensity), 2 = structural damage (ischemia, hematoma), 3 = hydrocephalus. N20 amp : 0 = N20 amplitude > 1,2 µV, 1 = N20 amplitude < 1,2 µV. Vasospasm : 0 = absence, 1 = monolateral, 2 = bilateral. Symptoms : 0 = absence, 1 = presence (arm paresis, hemiparesis, hemiplegia or/and consciousness alterations).
DISCUSSION
The coupling between neuronal activity and its blood supply is of critical importance to the physiology of the human brain. Subarachnoid hemorrhage causes high rates of neurological deficits following impaired regional brain perfusion (15), mainly due to alterations of vascular resistances and pressure autoregulation. The vessel section, πr², is inversely proportional to mean blood flow velocity V, and directly proportional to blood flow F (πr²= F/V). In simultaneous detection of bilateral MCA mean blood flow velocities, within one subject, we can assume constant the CPP, blood viscosity and length of measured segments of MCA. Consequently, changes in vascular resistance and blood flow, between hemispheres, due to vessels section reduction of MCA, can be evaluated in an indirect way, by a semi quantitative approach, comparing 1/vMCA detected simultaneously on both sides. Likewise, interhemispheric differences in cortical activity of the primary somatosensory area can be evaluated comparing the amplitude of the N20 waves. Our data demonstrate close correlation between the variations of 1/vMCA and cortical N20 amplitude, matching their respective interhemispheric ratios. Modifications of interhemispheric ratio of 1/vMCA correspond with analogue variations of interhemispheric ratio of N20 amplitude in a wide range of values, from 0.9 to 0.4-0.3 (p< 0.01), unless structural ischemic or haemorrhagic damage develops (Fig. 11). When 1/vMCA and N20 amplitude had symmetric interhemispheric values (both ratios >0.65) CTI/MRI scan showed absence of alterations in the MCA areas. When both values of 1/vMCA and N20 amplitude on the compromised hemisphere became <0.65 of the contralateral, CT/MRI scan images showed transient modifications in the affected MCA supplied brain area and clinical evaluation revealed corresponding lateralizing symptoms or consciousness alteration (patients No. 2,3,5,12,15); consequently this data seems to identify the ischemic risk threshold. This condition of ischemic penumbra is potentially reversible, until variations of 1/MCA and N20 amplitude correlate, even at interhemispheric ratio values of 0.3- 0.4, if such extreme variations prevail only for a short time. In fact, when both 1/vMCA and N20 amplitude were observed to have regained ratio >0.65 to contralateral values (patients No. 3, 5, 12, 15), the CT/MRI scan images of MCA area and clinical condition returned to normal. On the other hand, if both low ratio values persist, as shown in patient 2, who reached interhemispheric values <0.4 for three consecutive days, structural damage develops. When evident CT/MRI structural brain damage occurs subsequently (patient No.2), or immediately after SAH (patients No. 4, 8, 11), there is a lack of correlation, as pathologic amplitude (<1, 2 μV) or absence of N20, on the compromised side, reflects the tissue damage and determined stable interhemispheric ratio <0.65. Conversely, in this situation 1/vMCA reverted to a ratio >0.65 with respect to the contralateral. This lack of correlation is probably due to the loss of neurovascular coupling and suggests a luxury perfusion in ischemic areas which no longer vasoregulate. The three patterns described above are shown in the scatter diagram (Fig. 12). A previous study investigated correlation between SSEP Central Conduction Time (CCT) and vasospasm and found a statistically significant (p < 0.01) increase in actual CCT (6.7 msec) in only the severe grade of vasospasm (blood flow velocity >200 cm/s) in subarachnoid hemorrhage [24]. By contrast, in our approach, variations of 1/vMCA and N20 cortical amplitude showed correlation before damage developed and independently from vasospasm. The high correspondence between variation in vascular resistances due to vessel section and N20 amplitude can be explained by the close correlation between blood flow and electric activity in the cortical areas. In fact, the cortex, whose activity is expressed by the N20 amplitude, has greater ischemic sensitivity than the thalamus and medial lemniscus, which are involved in CCT [25]. In an experimental study of graded cerebral ischemia on an animal model, Burnett and colleagues demonstrated that the reduction in SSEP amplitude corresponds to a progressive regional CBF (rCBF) decrease and even a small reduction of as little as 10% in rCBF produces analogue modification in SSEP [26]. Similarly, in healthy subjects, linear coupling and linear covariation between N20-P22 amplitude and intensity of blood oxygen level-dependent functional magnetic resonance imaging (BOLD- fMRI) has been demonstrated [27, 28]. Correspondence between variations of 1/vMCA and N20 cortical amplitude in our data emerges whether vasospasm is detected or not, as it was detected in 23% of examinations of group 1 and in 57% of group 2. Recent studies reviewed by Pluta and colleagues suggest that vasospasm of larger arteries is only to be an epiphenomenon of early brain injury after SAH with consequent microvascular vasospasm, spreading depression and cortical dysfunction [8] and the difficulty in defining the correlation between vasospasm and ischemia has been highlighted: perfusion abnormality without macrovascular vasospasm in the watershed areas or in the vicinity of sulcal clots has been demonstrated [29]. Dankbaar and colleagues reported that vasospasm decreases cerebral perfusion, but corresponds with the least perfused region in only two thirds of patients; furthermore, almost half of patients with severe vasospasm do not have delayed cerebral ischemia (DCI), and, although severe vasospasm can decrease perfusion, it may not result in DCI [30]. Carrera and colleagues found that 40% of patients who developed DCI did not reach blood flow velocity (BFV) >120 cm/sec and 16% of patients never registered BFV >120 [31]. Some limitations of our study have to be considered. First, we considered a small number of patients and examinations (SSEP,TCCD and neuroimaging) were timed on the clinical basis evaluation, not following a specific protocol. Second, the semi quantitative comparison of data from both hemispheres can be missed if data change to the same pathologic extent bilaterally. On the basis of our approach, symmetric bilateral pathological variation of vascular resistances of MCA would correspond to analogue symmetric variation of N20 amplitude: in this case we could not evaluate the ischemic risk by only comparing the two ratios. We can hypothesize that a very low bilateral N20 amplitude, close to the pathological threshold of 1,2 μV, could be detected; however we found no such condition of symmetric bilateral pathological changes in our case series. Third, we evaluated modifications of MCA brain supplied area by CT or MRI, who detect changes with a different sensitivity; moreover, recently Dankbaar and colleagues demonstrated that CT perfusion (CTP) is more sensitive in detecting ischemic penumbra than CT [32], so its use could help to better define the three interhemispheric patterns of neurovascular coupling.
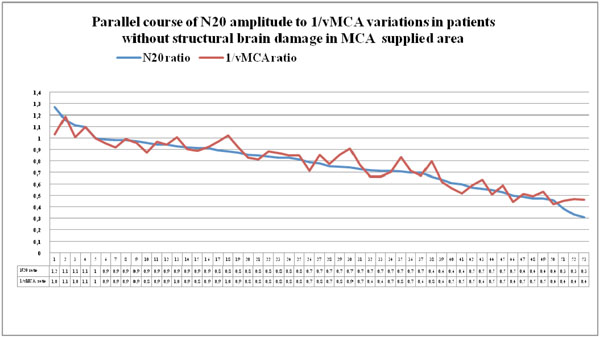
Couples of N20 and 1/vMCA ratio values detected in patients of group 1 and group 2, who had no CT/MRI image of structural ischemic or haemorrhagic injury in MCA supplied area, displayed in descending order. Modifications of interhemispheric ratio of 1/vMCA correspond with analogue variations in interhemispheric ratio of N20 amplitude in a wide range of values, from 0.9 to 0.4-0.3, (p<0.01, r = 0.93, Cl for r = 0.89 to 0.96 unless structural ischemic or haemorrhagic damage develops.
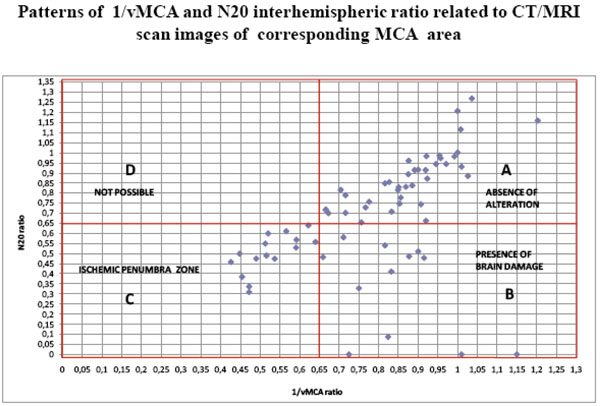
The scatter diagram shows the distribution of all 66 couples of 1/vMCA and N20 ratio values gathered in Table 3. Each point identifies a couple of 1/vMCA (X axis) and N20 (Y axis) interhemispheric ratio values. In section A, both 1/vMCA and N20 interhemispheric ratio values > 0.65 correspond to CT/MRI normal images of MCA supplied area: this is the area of absence of damage, where N20 amplitude and 1//vMCA values show interhemispheric symmetry. In section B, 1/vMCA ratios > 0.65 coupled with N20 ratios < 0.65 correspond with CT/MRI images of unilateral structural brain damage in the MCA supplied area: this is the brain injury area, where pathological amplitude or absence of N20 reflects the tissue damage, whereas 1/vMCA values reverting to those of the uninjured contralateral area suggests a luxury perfusion state. In section C, both 1/vMCA and N20 interhemispheric ratio values < 0.65 correspond with CT/MRI images of unilateral transient and reversible alterations in MCA supplied area; this condition is capable of reverting to normal (section A) or evolving to stable damage (section B): this section could be named “ ischemic penumbra zone”. In section D no ratio allocation is found: this area would correspond with a condition of unilateral hemispheric alteration of vascular resistances due to reduction of MCA vessel section and consequent low 1/v MCA ratio, in contrast to symmetrical bilateral N20 amplitude and high interhemispheric ratio value. It is reasonable to hypothesize an impossible coexistence of altered regional brain perfusion with normal cortical activity.
CONCLUSION
MCA vascular changes detected by TCCD in SAH show significant statistic linear correlation with cortical activity measured by the early cortical component (N20) of the somatosensory evoked potential from the median nerve. Three different patterns of neurovascular coupling were identified matching the interhemispheric ratios of N20 and reciprocal of MCA mean flow velocity detected within each patient, to CT scan or MRI images of MCA areas. 1) 1/vMCA and N20 ratios > 0.65 correspond with absence of neuroimaging alterations in MCA areas and lateralizing symptoms: this pattern indicates an ongoing equilibrium of neurophysiological and vascular condition. 2): both 1/vMCA and N20 values lower than 0.65 in respect of the contralaterals correspond with TC/MRI scan images of transient alterations in the MCA area and clinical evidence of lateralizing symptoms or consciousness modification: this pattern identifies a situation of reversible ischemic penumbra and can evolve either to the re-establishment of a normal and symmetric condition, expressed in pattern 1, where N20 and 1/vMCA absolute values show little or no interhemispheric difference; or to the next pattern. 3) 1/vMCA value > 0.65 and N20 amplitude < 0.65 in respect of the contralaterals correspond with TC/MRI scan images of hemispheric structural damage in the MCA area: this is a condition of evident structural ischemic or hemorrhagic damage in which there is a luxury perfusion in the injured brain area. Although more studies are required to confirm our hypothesis, we would like to emphasize the importance of simultaneous evaluation of somatosensory evoked potential and the TCCD to monitor the neurovascular coupling and to detect the ischemic penumbra due to MCA vascular changes in SAH, before the ischemic damage develops.
CONSENT
Written consent was obtained from the patients for publication of these case series and any accompanying images. A copy of the written consent is available for review from the Editor-in-Chief of this journal.
AUTHORS' CONTRIBUTIONS
PDP conceived the work, collected and analysed the data as well as collaborated in writing the article. PZ analyzed the data and collaborated in writing the article. MI analyzed the data and collaborated in writing the article. EB analyzed the data. EF analyzed the data and elaborated the statistical calculations. All authors have read and approved the final manuscript.
ACKNOWLEDGEMENTS
The authors wish to thank the teaching staff of Florence University Neurophisiology Department, in particular Pinto F. (PhD).The authors also extend their thanks the Rovigo Hospital ward director, Palù M. (MD), whose collaboration enabled the study to be carried out.
The manuscript has been proof read and corrected by Sheona Balish M.A. (ord), TOEFL qualified, a native English speaker.

