All published articles of this journal are available on ScienceDirect.

Genetic Analysis of Cytochrome P450 Polymorphisms in Drug-responsive and Drug-refractory Epileptic patients in Telangana
Authors Info & Affiliations
Abstract
Aim:
The present study aimed to evaluate the role of CYP2C9 and CYP2C19 genetic variations in drug-responsive/drug-refractory epilepsy, thereby facilitating the development of personalised drug strategies for effective treatment.
Background:
Cytochrome p450 was found to metabolize the drugs either by stimulation or by inhibition of cytochrome enzyme activity. CYP 450 genetic polymorphisms were postulated to influence the patient response to epileptic drugs by means of altered cytochrome enzyme activity resulting in varied therapeutic responses from patient to patient.
Objective:
The aim of the study is to evaluate the significance of CYP2C9 and CYP2C19 genetic variations in drug-responsive/drug-refractory epilepsy.
Methods:
A total of 65 subjects, 31 drug-refractory epilepsy cases and 34 drug-responsive epilepsy cases were included in the present study. The genetic analysis of CYP 450 2C9*2 (rs1799853), 2C9*3 (rs1057910), 2C19*2 (rs4244285) and 2C19*3 (rs4986893) polymorphisms was done by Polymerase Chain Reaction followed by Restriction Fragment Length Polymorphism. Statistical analysis was performed by online Medcalc software to evaluate the association of CYP polymorphisms with drug-responsive/drug-refractory epilepsy cases.
Results and Discussion:
In the present study, a total of 31 drug-refractory epilepsy and 34 drug-responsive epilepsy patients were enrolled. The clinical parameters like duration of seizures was significantly different in drug-refractory cases (P=0.0001) and the postictal features were significantly associated with drug-refractory cases (p=0.0124). Regarding the genetic analysis, our study results for CYP2C9*2 (rs1799853:C>T) polymorphism did not show a significant association with the drug-refractory cases. The T allele frequency was 0.03 in epileptic drug-responsive cases and was found to be 0.0 in drug-refractory cases. Genotype distribution of CC, CT and TT was found to be 93.7%, 6.3% and 0% in drug-responsive cases and 100%, 0% and 0% in drug-refractory cases, respectively. The CYP2C9*3 (rs1057910) polymorphism C-allele was not observed in both drug-refractory and responsive cases in the present study. AA genotype (100%) was found in both drug-responsive and refractory cases.
The study results for CYP2C19*2 (rs4244285) polymorphism did not show a significant association with the drug-refractory cases. The A allele frequency was 0.44 in epileptic drug-responsive cases and was found to be 0.45 in epileptic drug-refractory cases. Genotype distribution of GG, GA and AA was found to be 21.9%, 65.6% and 12.5% in drug-responsive cases and 20.83%, 70.84% and 8.33% in drug-refractory cases, respectively. The CYP2C19*3 (rs4986893) polymorphism did not show a significant association with the drug-refractory cases. The A allele frequency was 0.0 in epileptic drug-responsive cases and was found to be 0.0 in epileptic drug-refractory cases. Genotype distribution of GG, GA and AA was found to be 93.5%, 6.5% and 0% in drug-responsive cases and 100%, 0% and 0% in drug-refractory cases, respectively.
Conclusion:
In the present study, a significant difference was observed in the duration of seizures in the drug-refractory group and postictal features were significantly associated with the drug-refractory group. The genetic polymorphisms in CYP2C9*2, CYP2C9*3, CYP2C19*2, and CYP2C19*3 did not show any significant association with drug refractory epilepsy. However, the study has to be extended to a large sample for the establishment of the significance of the specified polymorphisms in drug-responsive/drug-refractory epilepsy.
1. INTRODUCTION
Epilepsy is the most common chronic neurological disease affecting 60 million people per annum [1]. In India, the prevalence of epilepsy varies from 3.0 to 11.9 per 1000 individuals and about 10-12 million people were reported to suffer from epilepsy [2, 3]. The exact cause of seizures is unknown in more than half of people with “idiopathic epilepsy”. With the advent of molecular genetic techniques, an exponential growth in the understanding of idiopathic epilepsies has been noticed and more than half of idiopathic epilepsies were attributed to genetic causes. In 2010, The International League Against Epilepsy (ILAE) modified the term “idiopathic epilepsy” to “genetically generalized epilepsy” [4, 5]. Case-control studies from India revealed a significant association of febrile seizure risk with epilepsy [6-8]. Another study from Chandigarh indicated the strong independent predictors of epilepsy as the family history of epilepsy, birth by difficult delivery, newborn seizures, developmental delay and head injury [9, 10].
Human Cytochrome P450 (CYPs) are membrane-associated proteins widely expressed in most of the tissues [11]. The distribution of specific CYPs varies from tissue to tissue and was found to have the highest expression in liver tissue [12], suggesting that the efficacy of a drug may depend on CYP expression in the target tissue. The CYP families 1, 2, and 3 were found to play roles in the metabolism of medicine, xenobiotics, and some endogenous compounds [13]. Most of the CYPs were found to metabolize the drugs either by stimulation or by inhibition of CYP activity. CYP enzyme activities significantly differed from individual to individual, resulting in various phenotypes.
Cytochrome P450 (CYPs) enzymes are heme-containing proteins found in both prokaryotes and eukaryotes. In mammals, the enzymes are membrane-bound in the endoplasmic reticulum and some are in mitochondria. After the completion of the Human genome sequencing project, about 57 distinct p450 genes were identified in humans, of which, 13 CYP functions are not yet known. P450s (3A4, 2D6, 2C9, 1A2, and 2C19) are involved in the metabolism of pharmaceutical products that occur in the liver and small intestine. Due to drug metabolism by CYPs, certain drugs are not prescribed together with their contraindications [14]. For example, taking birth control pills (17 α-ethynylestradiol) as the active estrogenic compound, is advised to avoid certain other drugs such as rifampicin, and phenytoin. Cytochrome P450 3A4 metabolizes most of the birth control pills, whereas both rifampicin and phenytoin induce the expression of P450 3A4 and lead to more clearance of the steroid (birth pill). The concentration of the 17 α-ethynylestradiol decreases which may lead to ovulation and result in unexpected pregnancy [15]. In another case, the inhibition of P450 3A4 by azole drugs and erythromycin, was found to cause reduced metabolism of terfenadine and result in death due to arrhythmia [16]. Intra-individual variability in drug metabolism could be due to P450s genetic polymorphisms. P450s 2D6, 2C9, and 2C19, which were involved in drug metabolism were known to harbor common genetic polymorphisms, i.e., differences in amino acid sequences that produce altered and usually lowered enzyme activity. Polymorphisms in these enzymes can lead to poor drug metabolism and more severe side effects.
Genetic variants of CYPs are known to exist at the individual level. The phenotype that these genes encode may have an impact on the metabolism of certain medicines. Individual allele combinations determine a person's ability to metabolize medicine. Each allele can be classified as either a variant defective (Variant) or a functional (wild-type) allele. Variant alleles may confer diminished or no activity, whereas wild-type alleles are “normal” and are more common in the general population. Individuals with two variant (defective) alleles will inherently have little to no enzyme activity (poor metabolizers), whereas those with two wild-type alleles would often have “normal” rates of metabolism (extensive metabolizers). One copy of each allele results in decreased enzymatic activity (intermediate metabolizers). Enzyme activity may occasionally be higher than usual when gene duplication or amplification produces more than two gene copies of wild-type alleles (ultrarapid metabolizers) [17]. Genetic polymorphisms in CYPs cause ineffective or abnormal prodrug activation and lead to toxicity [18, 19]. Apart from drug catabolism, most of the CYPs are important in the activation of chemotherapeutic prodrugs, as in cancer therapies [20, 21] and antipsychotics [22]. Advanced genetic techniques have enabled the genotyping of CYP Single Nucleotide Polymorphisms (SNPs) in patients and paved the way for the discovery of SNPs that alter the expression or activity of drug metabolizing enzymes [13, 23].
1.1. CYP2C9 Genetic Polymorphisms
Cyp2c9 is the most abundant CYP2C in the human liver, accounting for about 10% of total CYPs [24]. It is located on chromosome 10q23.33. More than 50 SNPs have been identified in the regulatory and coding regions of the CYP2C9 gene, but only two variants in the coding region, viz. CYP2C9*2 and CYP2C9*3 were functionally significant in the white population, with CYP2C9*2 (R144C) allelic frequency of 0% in Asians, 4% in African subjects and 11% in white subjects, while the CYP2C9*3 (I359L) polymorphism’s allele frequencies were 3% in Asians, 2% in African subjects and 7% in white subjects. Cytochrome p450 catalyses the oxidative metabolism of 10-20% of commonly prescribed drugs, including oral hypoglycemic agents (sulfonylureas), angiotensin II blockers and some Non Steroidal Anti Inflammatory Drugs (NSAIDs) [22, 25]. The CYP2C9*2 gene polymorphism rs1799853 is a transition from C>T at codon 430 in Exon3, which corresponds to an amino acid change from Arg144Cys in the polypeptide chain. The CYP2C9*3 gene polymorphism rs1057910 is a transversion from A>C at A1075C position corresponding to an amino acid change from Ile359Leu. These polymorphisms were reported to be associated with reduced enzyme activity in drug metabolism [26].
1.2. CYP2C19 Genetic Polymorphisms
The CYP2C19 gene is localized on chromosome 10q24. Cyp2c19*2 and CYP2C19*3 are the two genetic variations associated with the synthesis of truncated proteins due to amino acid substitutions at positions 681 and 636, respectively. CYP2C19*2 gene SNP rs4244285 is a transition from G>A in exon-5 (G681A) leading to an aberrant splicing site thereby creating a stop codon and thus forming a truncated protein that is functionally inactive [27]. CYP2C19*2 variants cause poor metabolizers, which affect approximately 12-23% of Asians, 4-18% of Blacks, and 3-5% of Caucasians. CYP2C19 gene is involved in the hydroxylation of omeprazole. A ten-fold difference was observed in the oral clearance of omeprazole in poor metabolizers. In poor metabolizers due to low enzymatic activity (CYP2C19*2) concentration of omeprazole markedly increased when compared to normal metabolizers, hence significantly higher cure rates for gastric and duodenal ulcers were seen in poor metabolizer genotype of CYP2C19 [28, 29]. The CYP2C19*3 gene polymorphism rs4986893 is a transition from G>A (G636A), where A allele was found to be the risk allele. The CYP2C19*3 polymorphic variant in either homozygous (AA) or heterozygous (GA) state has been linked to poor metabolism of compounds like mephenytoin and proguanil, therefore implicated in malaria prophylaxis [30].
The present study was aimed at genetic analysis of CYP450 polymorphisms for their clinical significance in drug-responsive or drug-refractory epilepsy and ultimately to facilitate the development of personalized treatment strategies for better management of epilepsy.
2. MATERIALS AND METHODS
2.1. Study Design
2.1.1. Selection of Subjects
The present study is a pilot study. A total of 65 subjects were included in the current study, comprised of 31 drug-refractory epilepsy cases and 34 drug-responsive epilepsy cases attending the Department of Neurology, Osmania General Hospital, a premier tertiary care hospital in the state of Telangana. The study subjects were recruited since the protocol approval by the institutional ethics committee i.e. 10.03.2016. An informed consent was obtained from each participant or from a responsible adult/attendant in the case of minor participants. Drug-resistant epilepsy has been defined as the failure of adequate trials of two tolerated, appropriately chosen and used AED (ILAE task force). Detailed information on the seizure frequency and duration of seizure were recorded. Patients were grouped according to age and seizure type (focal/generalized). The drug-responsive patients were followed up quarterly while the drug-refractory patients were followed up every fortnight to obtain information on seizure frequency, duration of seizures and patient response to the epileptic drug. The relevant demographic-clinical data and dosage information were obtained in structured proforma from the patients and clinical investigation reports, respectively. The data for the genetic investigations were obtained from the PCR-RFLP experiments on DNA samples extracted from the study subjects.
2.1.1.1. Inclusion Criteria
Patients who attended the department of Neurology at Osmania General Hospital and confirmed with epilepsy were included in the study.
2.1.1.2. Exclusion Criteria
Patients in whom seizures were due to precipitating factors like meningoencephalitis, stroke, tumors, trauma, focal structural lesions (granuloma /abscess), alcohol withdrawal and metabolic disturbances were not included in the study.
2.1.1.3. Diagnostic Criteria
Drug-resistant/Drug-refractory epilepsy has been defined as failure of adequate trials of two tolerated, appropriately chosen and used AED as per the criteria of ILAE task force.
2.1.1.4. Institutional Ethics Committee Clearance
The current study was presented in front of the Institutional Ethics Committee of Osmania Medical College, Koti, Hyderabad and approved by the Ethics committee certificate dated 10.03.2016. All the study procedures adopted were in compliance with the guidelines of the Indian Council of Medical Research and followed the Helsinki Declaration for human subjects.
2.2. Genotype Analysis of CYP Polymorphisms
Three milliliters of peripheral venous blood samples were collected from all study subjects in an EDTA vacutainer. Genomic DNA was isolated from the whole blood by the in-house standardized Salting method of Lahiri et al., (1991) [31] and stored at -20°C for further use. The genotype analysis of the CYP 450 2C polymorphisms was performed by the Polymerase Chain Reaction- Restriction Fragment Length Polymorphism method.
2.2.1. Methodology of CYP2C9*2 Genotype Analysis
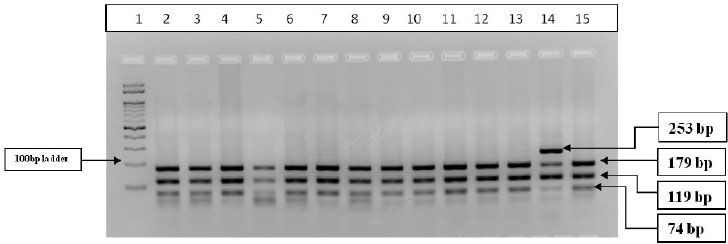
Three-step PCR was performed with the specific primers for amplification of CYP2C9*2, rs1799853 single nucleotide variation (Exon3, C>T change). The Forward Primer: 5’CACTGGCTGAAAGAGCTAACAGAG3’ and Reverse Primer: 5’GTGATATGGAGTAGGGTCACCCAC3’ as described earlier [32] were synthesized and supplied commercially by SahageneTM, Hyderabad. The three-step PCR conditions included an initial denaturation at 94°C for 5min, followed by 35 cycles of denaturation at 94°C for 30s, annealing at 65°C for 30s and extension at 72°C for 40s, final extension at 72°C for 5 min. The PCR products were then electrophoresed on a 2% agarose gel and the amplified bands were visualized in Bio-RadTM ultraviolet gel documentation system. The PCR product (372bp) was subjected to restriction digestion with Cfr13I (Sau96I, restriction site: 5’GGNCC3’) restriction enzyme by incubation for 3 hours at 37°C in a water bath. The restriction-digested products were then electrophoresed on 3% agarose gel and the bands were analyzed in Bio-RadTM ultraviolet gel documentation system. Based on the restriction fragment length polymorphism analysis, the restriction digestion band pattern is as follows: homozygous wild type (CC) [179bp+119bp+74bp], heterozygous (CT) [253bp+179bp+119bp+74bp] and homozygous variant (TT) [253bp+119bp bands]. The banding pattern was observed and the genotypes of the genetic polymorphism were recorded (Table 1, Figs. 1, 2).
| S.NO | Gene/SNP | Primer Sequence 5’ TO 3’ | Annealing Temperature | PCR Product Size | Restriction Enzyme | Restriction Digestion Pattern |
|---|---|---|---|---|---|---|
| 1 | CYP2C9*2/ rs1799853 |
CYP2C9*2-FP: CACTGGCTGAAAGAGCTAACAGAG CYP2C9*2-RP: GTGATATGGAGTAGGGTCACCCAC |
65°C | 372 bp | Cfr13I (Sau96I) | CC-179bp+119bp+74bp CT-253bp+179bp+119bp+74bp TT-253bp+119bp |
| 2 | CYP2C9*3/ rs1057910 |
CYP2C9*3-FP: AGGAAGAGATTGAACGTGTGA CYP2C9*3-RP: GGCAGGCTGGTGGGGGAAGGCCAA |
65°C | 130 bp | StyI | AA-130bp, AC-130bp+104bp+26bp CC- 104bp+26bp |
| 3 | CYP2C19*2/ rs4244285 |
CYP2C19*2-FP: AATTACAACCAGAGCTTGGC CYP2C19*2-RP: TATCACTTTCCATAAAAGCAAG |
58°C | 169 bp | Sma I | GG-120bp+49bp, GA-169bp+120bp+49bp AA- 169bp |
| 4 | CYP2C19*3/ rs4986893 |
CYP2C19*3-FP: ATTGAATGAAAACATCAGGATTGCYP2C19*3- RP: ACTTCAGGGCTTGGTCAATA |
55°C | 132 bp | BamH I | GG-96bp+36bp, GA-132bp+96bp+36bp AA- 132bp |
2.2.2. Methodology of CYP2C9*3 Genotype Analysis
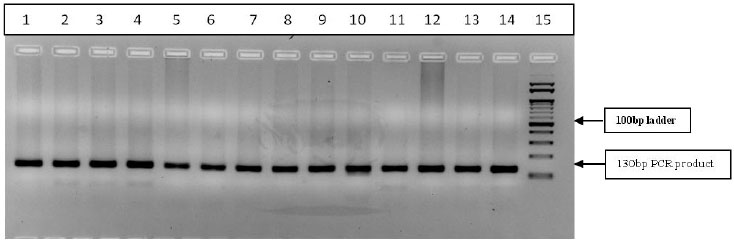
Three-step PCR was performed with the specific primers for amplification of CYP2C9*3, rs1057910 single nucleotide change (A1075C, A>C). The Forward Primer: 5’AGGAAGAGATTGAACGTGTGA3’ and Reverse Primer: 5’GGCAGGCTGGTGGGGGAAGGCCAA3’ as described earlier [32] were synthesized and supplied commercially by SahageneTM, Hyderabad. The three-step PCR conditions included an initial denaturation at 94°C for 5min, followed by 35 cycles of denaturation at 94°C for 30s, annealing at 65°C for 30s, extension at 72°C for 40s and final extension at 72°C for 5 min. The PCR products were then electrophoresed on a 2% agarose gel and the amplified bands were analyzed in Bio-RadTM gel documentation system. The PCR product (130bp) was subjected to restriction digestion with StyI restriction enzyme (restriction site: 5’CCWWGG3’) for 3hrs at 37°C in a water bath. The restriction-digested products were then electrophoresed on 3% agarose gel and bands were analyzed in Bio-RadTM gel documentation system. Based on the restriction fragment length polymorphism analysis, the restriction digestion band pattern is as follows: the wild type homozygous (AA) [130bp], heterozygous (AC) [130bp+104bp+26bp] and homozygous variant (CC) [104bp+26bp]. The banding pattern was observed and genotypes were noted (Table 1 and Fig. 3).
2.2.3. Methodology of CYP2C19*2 Genotype Analysis
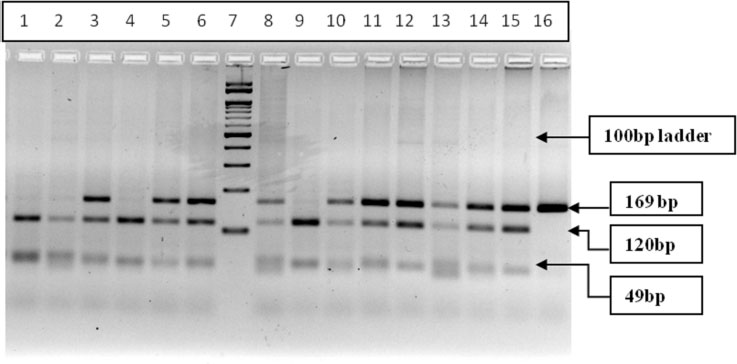
Three-step PCR was performed with the specific primers for amplification of CYP2C19*2 gene (rs4244285), single nucleotide variation (681G>A), in exon-5. The Forward Primer: 5’AATTACAACCAGAGCTTGGC3’ and Reverse Primer: 5’TATCACTTTCCATAAAAGCAAG3’ as described earlier [33] were synthesized and supplied commercially by SahageneTM, Hyderabad. The three-step PCR conditions included an initial denaturation at 94°C for 5 min, followed by 35 cycles of denaturation at 94°C for 30s, annealing at 58°C for 40s, extension at 72°C for 30s and final extension at 72°C for 5 min. The PCR products were then electrophoresed on a 2% agarose gel, and the amplified bands were visualized on Bio-Rad gel documentation system. The PCR product (169bp) was subjected to restriction digestion with SmaI restriction enzyme (restriction site: 5’CCCGGG3’) for 2hrs at 37°C in a water bath. The restriction-digested products were then electrophoresed on 3% agarose gel and the bands were visualized in Bio-RadTM gel documentation system. Based on the restriction fragment length polymorphism analysis, the restriction digestion band pattern is as follows: homozygous wild type (GG) [120bp+49bp], heterozygous (GA) [169bp+120bp+49bp] and homozygous variant (AA) [169bp] band. The RFLP banding pattern was recorded and genotypes were noted (Table 1 and Fig. 4).
2.2.4. Methodology of CYP2C19*3 Genotype Analysis
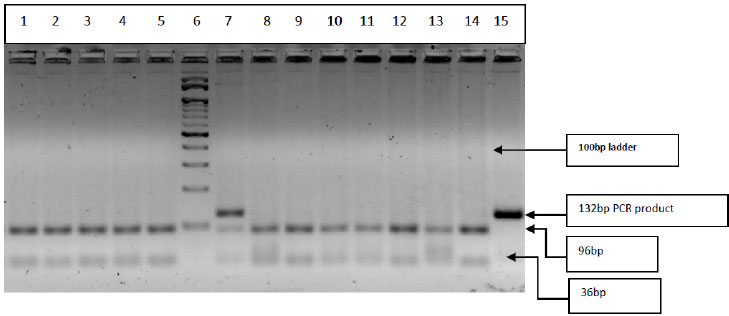
Three step PCR was performed with the specific primers for amplification of CYP2C19*3 gene (rs4986893) single nucleotide variation G>A, G636A. The Forward Primer: 5’ATTGAATGAAAACATCAGGATTG3’ and Reverse Primer: 5’ACTTCAGGGCTTGGTCAATA3’ as described earlier [34] were synthesized and supplied commercially by SahageneTM, Hyderabad. The three-step PCR conditions included an initial denaturation at 94°C for 5min, followed by 35 cycles of denaturation at 94°C for 30s, annealing at 55°C for 40s, extension at 72°C for 30s, and final extension at 72°C for 5 min. The PCR products were then electrophoresed on a 2% agarose gel and amplified bands were visualized on Bio-RadTM gel documentation system. The PCR products (132bp) were subjected to restriction digestion with BamHI restriction enzyme (restriction site: 5’GGATCC3’) for 3hrs at 37°C in a water bath. The restriction-digested products were then electrophoresed on 3% agarose gel and the bands were visualized in Bio-RadTM gel documentation system. Based on the restriction fragment length polymorphism analysis, the restriction digestion band pattern is as follows: homozygous wild type (GG) [96bp+36bp], heterozygous (GA) [132bp+96bp+36bp] and homozygous variant (AA) [132bp] band. The RFLP band pattern was recorded and genotypes were noted (Table 1 and Fig. 5).
2.3. Statistical Analyses
Statistical analysis was done by using online MedCalc’s statistical calculator (https://www.medcalc.org/calc/) [35]. Chi-square (χ2) test was done to find out the significant difference in seizure frequencies between drug-responsive and drug-refractory cases. The risk of carrying CYP 450 genetic polymorphisms was represented by Odds Ratio (OR), with 95% confidence interval (CI), at the 5% level of significance i.e.0.05. The significance of the assessment of the descriptive clinical variables was evaluated by odds ratio in comparative groups of drug-responsive and drug-refractory epilepsy. With regard to the genetic analysis, the genotype frequencies and allelic frequencies were assessed by Hardy-Weinberg Equilibrium. Genotypes in comparative groups were evaluated by odds ratio using the Medcalc online calculator [35]. Of the total samples, results for a few were not detectable for the specified genetic polymorphisms. Hence, the present data represented denotes the actual values for each polymorphism investigated without any statistical manipulation or corrections.
3. RESULTS
The present pilot study had recruited clinically confirmed epilepsy patients from a tertiary care hospital in Telangana and included the patients only after obtaining informed written consent from each individual for the study of drug-response and their association with CYP gene polymorphisms. A total of 65 subjects, 31 drug-refractory epilepsy cases and 34 drug-responsive epilepsy cases were included in the present study. Of these samples, results for a few were not detectable for the specified genetic polymorphisms. Hence, the present data represented in the results denotes the actual values for each polymorphism investigated without any statistical manipulation or corrections.
3.1. Demographic and Clinical Profile of Patients
A total of 31 drug-refractory patients were included, of which, 14 were males and 17 were females, with an age range between 8-60 years. All patients had GTCS. The treatment included phenytoin, clobazam (2), and valproate (5). Phenytoin and carbamazepine were given to one patient and Valproate and phenytoin were given to 23 patients. The seizure frequency was observed to be once in a week to once in 2 months.
In the drug responsive group, 34 patients were included, of which, 18 were males and 14 were females. All these were on monotherapy, phenytoin was given to 25 patients and valproate to the remaining patients. All of them were seizure-free after the start of the Anti-Epileptic Drug (AED). The treatment was continued for a period of 3 years. No recurrence was observed in this group. The neurological examination and imaging were normal in all patients. One patient with left frontal gliosis had only one seizure and there was no recurrence and hence was included in the responsive group.
In drug-refractory epileptic case group, 48.4% were males and 51.6% were females. The mean age of the drug-refractory cases was found to be 32.9±14.3yrs. Patients were treated with phenytoin (5mg/kg) and sodium valproate 500mg bid, carbamazepine 300-600 mg bid. The majority of the patients were on two drugs and one patient was on three drugs. The mean duration of treatment in drug-refractory cases was 6.69±5.11 years. In drug-responsive cases, 56.2% were males and 43.8% were females. The mean age of the drug-responsive cases was 39.1±15.5yrs. The mean duration of the treatment of drug-responsive cases was 3.9±0.89 yrs.
The present study observed clinical parameters like duration of the seizures; ≈ 1min in 96.8% of the cases and ≈ 2 min in 3.2% of drug-responsive cases, whereas in drug-refractory cases the duration of seizures observed was ≈ 1 min in 39.2% of cases and ≈ 2 min in 69.2% of the cases. As the patients were admitted for evaluation and imaging, they were observed by duty postgraduates and nursing staff to obtain data on seizure duration. The drug-responsive patients were followed up quarterly while the drug-refractory patients were followed up every fortnight. The patients were also followed up either directly during their consecutive visits to the hospital or with their parents or attendants for information on seizure frequency, duration of the seizures and patient response to the epileptic drug. The significance of the difference between the variables was evaluated by Chi-square test and the association between the variables was evaluated by odds ratio in drug-responsive and drug-refractory epilepsy groups. There is a significant difference in seizure duration observed between drug-responsive and drug-refractory epilepsy cases (P=0.0001). Postictal features (headache, sleepiness, confusion) after a seizure attack were seen more commonly in drug-refractory cases than drug-responsive cases. The presence of postictal features was significantly different in drug-refractory cases compared to the drug responsive group. (P=0.0124) (Table 2).
| S.NO. | Variable |
Drug-refractory Epilepsy Cases n (%) |
Drug-responsive Epilepsy Cases n (%) | OR (95% CI) | P-value |
|---|---|---|---|---|---|
| 1 | Type of seizure | GTCS- 27 (96.4%) TONIC- 01 (3.6%) |
GTCS- 28 (87.5%) TONIC- 01 (3.2%) |
1.9286 (0.165-22.52) |
0.6005 |
| 2 | Duration of seizures | 1 min- 8 (30.8%) 2 min- 16 (69.2%) |
1 min- 31 (96.8%) 2 min- 1 (3.2%) |
69.75 (8.05-603) |
0.0001* |
| 3 | Post ICTAL features (Headache, Sleepiness, Confusion,) |
Post ICTAL features present -13 (46.4%) Post ICTAL features absent- 15 (53.6%) |
Post ICTAL features present –05 (15.6%) Post ICTAL features absent- 27 (84.4%) |
4.68 (1.39-15.68) |
0.0124* |
| 4 | Family history | Yes- 01(3.6%) No- 27 (96.4%) |
Yes- 0 (0%) No- 32 (100%) |
3.545 (0.138-90.59) |
0.4440 |
| 5 | Triggers | Yes- 2 (7.1%) No -26 (92.9%) |
Yes- 0 (0%) No - 32(100%) |
6.132 (0.282-133.3) |
0.2484 |
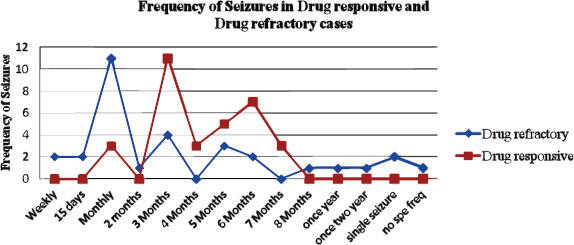
| Variable | Frequency | Drug-refractory Epilepsy Cases | Drug-responsive Epilepsy Cases | X2 Value | P-value |
|---|---|---|---|---|---|
| Seizure frequency | 0 to 1 Month | 15 | 3 | 18.7598 | 0.000876* |
| 2 to 3 Months | 4 | 11 | |||
| 4 to 5 Months | 4 | 8 | |||
| 6 to 7 Months | 2 | 10 | |||
| >8 Months | 6 | 3 | |||
| Total | 31 | 35 | - | - |
The frequency of seizures in drug-refractory and drug-responsive epilepsy cases is graphically represented in Fig. (1) The Chi-square (χ2) test was done to find out the significant difference in seizure frequencies between drug-responsive and drug-refractory cases. The seizure frequency distribution at 0-1month, 2-3months, 4-5months, 6-7months and more than 8 months were compared between drug refractory and drug-responsive epilepsy cases and the χ2 analysis revealed that there was a significant difference in the seizure frequency distribution between drug refractory and drug-responsive epilepsy cases (P=0.000876*) (Table 3).
3.2. CYP2C9*2 (rs1799853) Genotype Analysis
A total of 32 drug-responsive cases and 24 drug-refractory cases were screened for CYP2C9*2, rs1799853 polymorphism. The PCR-RFLP gel banding pattern is represented in Fig. (2) The allelic distribution was found to be in the Hardy-Weinberg equilibrium. The C allele frequency in drug responsive cases was found to be 0.97 and T allele was 0.03. The C allele frequency in drug-refractory cases was found to be 1 and T allele frequency was found to be 0 (Table 4). The allelic frequency of CYP2C9*2 polymorphism was compared in epileptic drug-responsive cases and epileptic drug-refractory cases and neither of the alleles was associated with drug-refractive epilepsy (p=0.3851). The genotype distribution of CC, CT and TT was found to be 93.7%, 6.3% and 0% in drug-responsive cases and 100%, 0% and 0% in drug-refractory cases, respectively. The genotype distribution of CYP2C9*2 polymorphism was compared in different combinations in epileptic drug-responsive cases and drug-refractory cases, and the odd’s risk estimates did not reveal any significant association with drug-refractory cases (Table 4).
PCR products (372bp) digested with Cfr13I (Sau96I) restriction enzyme and restriction digestion band pattern represented in figure 2: Well no-1 100bp Marker, well no. 2-13 & 15-Wild type (CC) 179bp+119bp+74bp, well no-14 -Heterozygous (CT) 253bp+179bp+119bp+74bp.
3.3. CYP2C9*3 (rs1057910)
A total of 32 drug responsive cases, 27 drug-refractory cases were screened for CYP2C9*3, rs1057910 polymorphism. The PCR-RFLP gel banding pattern is represented in Figure 3. The allelic distribution was found to be in the Hardy-Weinberg equilibrium. The A allele and C allele frequencies were found to be 1 and 0, respectively, in both drug-responsive and drug-refractory cases (Table 5). The allelic frequency of CYP2C9*3 polymorphism was compared in epileptic drug-responsive cases and epileptic drug-refractory cases and found to be not associated with drug refractive epilepsy (p=0.9332) (Table 5). The genotype distribution of AA, AC and CC was found to be 100%, 0% and 0%, respectively in both drug responsive cases and drug-refractory cases, The genotype distribution of CYP2C9*3 polymorphism was compared in different genotypic combinations of epileptic drug responsive and epileptic drug-refractory cases and odds risk estimates were derived with no significant difference (p=0.9340) (Table 5).
| Genotype | Drug-responsive Cases (n=32) | Drug -refractory Cases(n=24) | OR (95% CI) | P-value | |
|---|---|---|---|---|---|
| CC | 30 (93.7%) | 24 (100%) | Reference | - | |
| CT (CC vs CT) |
2 (6.3%) | 0 (0%) | 0.2490 (0.0114-5.4317) | 0.3767 | |
| TT (CC vs TT) |
0 (0%) | 0 (0%) | 1.2449 (0.0238-65.0369) | 0.9136 | |
| Alleles | - | - | - | - | |
| C | 62 (0.97) | 48 (1.0) | Reference | - | |
| T | 2 (0.03) | 0 (0) | 0.2577 (0.0121-5.494) | 0.3851 | |
| Genotype | Drug-responsive Cases (n=32) | Drug-refractory Cases(n=27) | OR (95% CI) | P-value |
|---|---|---|---|---|
| AA | 32 (100%) | 27 (100%) | Reference | - |
| AC (AA vs AC) |
0 (0%) | 0 (0%) | 1.1818 (0.0227-61.547) | 0.9340 |
| CC (AA vs CC) |
0 (0%) | 0 (0%) | 1.1818 (0.0227-61.547) | 0.9340 |
| Alleles | - | - | - | - |
| A | 64 (1) | 54 (1) | Reference | - |
| C | 0(0) | 0 (0) | 1.1835 (0.0231-60.6438) | 0.9332 |
| Genotype | Drug-responsive Cases (n=32) | Drug-refractory Cases (n=24) | OR (95% CI) | P-value |
|---|---|---|---|---|
| GG | 7 (21.9%) | 5 (20.83%) | Reference | - |
| GA (GG vs GA) |
21 (65.6%) | 17 (70.84%) | 1.133 (0.304-4.21) | 0.851 |
| AA (GG vs AA) |
4 (12.5%) | 2 (8.33%) | 0.700(0.090-5.432) | 0.733 |
| Alleles | - | - | - | - |
| G | 35 (0.55) | 27 (0.56) | Reference | - |
| A | 29 (0.45) | 21 (0.44) | 0.938 (0.442-1.993) | 0.869 |
PCR products (130bp) digested with StyI restriction enzyme and restriction digestion band pattern shown in figure 3: Well no. 1-13 Wild type (AA) 130bp, no-14, PCR product (undigested sample) (In the present analysis, the heterozygous (AC)-130bp+104bp+26bp and homozygous Variant (CC)-104bp+26bp bands were not detected).
3.4. CYP2C19*2 (rs4244285)
A total of 32 drug-responsive cases, 24 drug-refractory cases were screened for CYP2C19*2 rs4244285 polymorphism. The PCR-RFLP gel banding pattern is represented in Fig. (4). The allelic distribution was found to be in the Hardy-Weinberg equilibrium. The G allele frequency in drug-responsive cases was 0.55 and A allele was 0.45. The G allele frequency in drug-refractory cases was 0.56 and A allele was 0.44 (Table 6).
The allelic frequency of CYP2C19*2 polymorphism was compared in epileptic drug-responsive cases and epileptic drug-refractory cases and revealed no significant association of alleles with drug refractory epilepsy (p=0.869) (Table 6). The genotype distribution of GG, GA and AA was found to be 21.9%, 65.6% and 12.5%, respectively in drug-responsive group, while the frequency of GG, GA and AA was 20.83%, 70.84% and 8.33% in drug-refractory cases (Table 6), The genotype distribution of CYP2C19*2 polymorphism was compared in different genotypic combinations in epileptic drug-responsive and drug-refractory cases and odds risk estimates did not reveal any significant association (p>0.05) (Table 6).
PCR products (169bp) digested with SmaI restriction enzyme and restriction digestion band pattern represented in Fig. (4): Well no. 1,2,4 & 9- Homozygous wild type (GG) 120bp+49bp, well no-3,5,6,8,10-15 Heterozygous (GA) 169bp+120bp+49bp and Homozygous Variant (AA) 169bp band, well no-7 100bp Marker.
3.5. CYP2C19*3 (rs4986893)
A total of 31 Epileptic drug-responsive cases, 25 Epileptic drug -refractory cases were screened for CYP2C19*3 rs4986893 polymorphism. PCR-RFLP gel banding pattern is represented in Fig. (5). The allelic distribution was found to be in the Hardy-Weinberg equilibrium. The G allele frequency in drug-responsive cases was 0.97 and A allele was 0.03. The G allele frequency in drug-refractory cases was found to be 1 and A allele frequency was found to be 0 (Table 7). The allelic frequency of CYP2C19*3 polymorphism was compared in epileptic drug-responsive cases and epileptic drug-refractory cases and revealed no significant association of alleles with drug refractive epilepsy (p=0.360) (Table 6). The genotype distribution of GG, GA and AA was found to be 93.5%, 6.5% and 0%, respectively in drug-responsive group, while the frequency of GG, GA and AA was 100%, 0% and 0%, respectively in drug-refractory cases (Table 7), The genotype distribution of CYP2C19*3 polymorphism was compared in different combinations in epileptic drug-responsive cases and epileptic drug-refractory cases and odds risk estimates revealed no significant association with drug-refractory epilepsy (p>0.05) (Table 7).
| - | Drug-responsive Cases (n=31) | Drug -refractory Cases (n=25) | OR (95% CI) | P-value |
|---|---|---|---|---|
| Genotype | - | - | - | - |
| GG | 29 (93.5%) | 25 (100%) | Reference | - |
| GA (GG vs GA) |
02 (6.5%) | 0 (0%) | 0.231 (0.010-5.046) | 0.352 |
| AA (GG vs AA) |
0 (0%) | 0 (0%) | 1.156 (0.022-60.42) | 0.942 |
| Alleles | - | - | - | - |
| G | 60 (0.97) | 50 (1) | Reference | - |
| A | 2 (0.03) | 0 (0) | 0.239 (0.0112-5.106) | 0.360 |
PCR products (132bp) digested with BamHI restriction enzyme and restriction digestion band pattern represented in Fig. (5): Well no. 1-5 & 8-14-Homozygous wild type (GG) 96bp+36bp, well no-7 Heterozygous (GA) 132bp+96bp+36bp and well no.15 undigested-PCR product &well no-6 100bp Marker. (In the present analysis, the homozygous variant (AA) 132bp band was not detected).
4. DISCUSSION
The cytochrome P450 (CYP) proteins are monooxygenases that catalyse numerous chemical processes essential for drug metabolism and the production of steroid hormones, cholesterol and other lipids, etc. The metabolism of medicinal drugs and other xenobiotics such as the anticonvulsant medicine mephenytoin, omeprazole, diazepam, and several barbiturates is largely regulated by the enzyme cytochrome P450 (CYP) [36]. Enzyme induction and enzyme inhibition are the two main types of drug interactions involving the P450 isoforms. P450 isozymes typical substrates, inhibitors, and inducers. While enzyme induction can boost metabolism, enzyme inhibition decreases it. It has been estimated that six key enzymes (CYP1A2, 2C9, 2C19, 2D6, 2E1, and 3A4/5) are responsible for 90% of human drug oxidation. Genetic variations in CYP2C19 (2&3) and CYP2C9 (2&3) are frequent and could influence a drug's therapeutic response. Based on the enzyme activity levels and drug metabolism, three different phenotypes are identified, normal metabolizers, intermediate metabolizers, and poor metabolizers [37]. Polymorphism within these genes is linked to an altered ability to metabolize mephenytoin categorized as the poor metabolizer and extensive metabolizer phenotypes. Furthermore, it is postulated that variations in the genes coding CYP450 enzymes contribute to inter-individual variations in serum concentration of drug substrates leading to inter-patient variability in terms of drug efficacy [38].
In the present study, with regard to the demographic profile of the epileptic patients, of the 31 drug-refractory cases, 45.2% were males and 54.8% were females. The mean age of the drug-refractory cases was found to be 32.9 ±14.3yrs. The mean duration of the treatment of drug-refractory cases was 6.69 ± 5.11 years. All drug-refractory cases had generalized tonic-clonic seizures, with varied seizure frequencies (Table 3). Drug of choice for the drug-refractory cases were phenytoin, valproate, phenytoin, and clobazam. In drug-responsive cases, of the 34 patients, 56.2% were males and 43.8% were females. The mean age of the drug-responsive cases was 39.1±15.5 yrs. The mean duration of the treatment of drug-responsive cases is 3.9±0.89 years. In the drug-responsive group, the patient response to monotherapy with the antiepileptic drug phenytoin /valproate was good and there were no seizures after the start of the treatment. The AED therapy had been continued for three years and no recurrence was observed in this group. In the present study, the drug-responsive cases have shown seizure-free response to treatment in 3 months in 34.4%, 6 months in 21.8% of the cases, and in drug-refractory cases, it was as early as 1 month in 35.5% and 6 months in 6.5% of the cases (Fig. 1). There was a significant difference observed in the seizure-free duration in response to treatment between the drug-refractory and drug-responsive group (p=0.000876). The drug-responsive epileptic patients treated with single drugs like Phenytoin (78.1%), Valproate (15.6%), and Carbamazepine (6.3%) showed good response to treatment. In non-responsive drug-refractory epileptic group, single-drug therapy used was Phenytoin (71.4%), Valproate (17.9%), and Phenytoin along with valproate (7.1%) Phenytoin+valproate+Carbamazepine (3.6%) cases. In the non-responsive drug-refractory group, 11% of the treated cases were shown to have not responded to a single anti-epileptic drug and were treated with a combination of drugs. This could be due to the interindividual genetic variations and further attributed to the implication of genetic heterogeneity in terms of drug therapeutic response.
In the present study, the genetic polymorphisms in two enzymes of the CYP2C subfamily, i.e., CYP2C9 and CYP2C19, were screened in epileptic drug-responsive and drug-refractory cases. Studies [15, 22, 26, 28, 29] have shown that CYP2C9 is involved in the metabolism of Non-Steroidal Anti-Inflammatory Drugs (NSAIDs), tolbutamide (hypoglycemic drug), phenytoin, and losartan (angiotensin-II receptor antagonist), whereas CYP2C19 plays role in the metabolism of propanolol, omeprazole (proton pump inhibitor), the benzodiazepine diazepam, antidepressant amitriptyline and anticonvulsant mephenytoin.
Regarding the CYP2C9 gene, the two variants CYP2C9*2 and CYP2C9*3, have functional consequences to be genotyped [29]. CYP2C9*2 gene polymorphism (rs1799853) located at Exon3 codon 430 a single nucleotide change from C>T leading to amino acid change i.e. Arg144Cys. CYP2C9*3 gene polymorphism (rs1057910) codes for Ile359Leu due to a change in a single nucleotide (A>C) at A1075C position. CYP2C9*2 (Arg144Cys) and CYP2C9*3 (Ile359Leu) result from single-amino acid substitutions in the CYP2C9. These polymorphisms were reported to be associated with a reduction in the drug-metabolizing enzyme’s activity [26]. Patients with the CYP2C9*2 allele (Arg144Cys) and the CYP2C9*3 allele (I359L) were shown to have reduced activity of the enzyme, these patients require lower maintenance doses of warfarin. Higashi et al., (2002) [39] in their retrospective cohort study demonstrated the association of these two polymorphisms with increased anticoagulation resulting in bleeding events among patients treated with warfarin. In a study conducted by Makowska M et al., (2021) [40] in Poland, the presence of CYP2C9*2 TT genotype (rs1799853) proved to be statistically insignificant in influencing the epileptic drug-response. The presence of T allele enhanced almost twice the risk of epilepsy occurrence. CYP2C9*3, only the AA genotype (rs1057910) was reported both in drug-responsive and refractory cases. Neither of the risk genotypes (AG, GG) were identified in the drug-responsive and refractory cases as the allelic distribution of G allele was found to be 0.
Van der Weide et al., (2001) [41] in his study showed a substantial link between the CYP2C9 genotype and phenytoin maintenance dosage requirements. Mutant CYP2C9*2 T allele and CYP2C9*3 C alleles were associated with poor drug metabolism and function, but they also served as a barrier to the development of AED (anti-epileptic drug) resistance. A study from southern India found that CYP2C9 variants (CYP2C9*2 T allele, CYP2C9*3 C allele) played a significant role in phenytoin hydroxylation [42]. The CYP2C9 gene's rs1799853 polymorphism showed a predominance of the T allele, with four times increased risk of treatment resistance in epilepsy patients in Poland [40]. In the Chinese Han’s population, the average daily dose of warfarin required for treatment in mutant CYP2C9*2 (T allele) and CYP2C9*3 (C allele) was lower than that of wild-type CYP2C9 genotypes (CC and AA) [43]. All these studies revealed that CYP2C9*2 and CYP2C9*3 allelic frequencies were segregated in varied patterns in different study populations.
In the present study, both drug-responsive and drug-refractory groups did not show any significant variation in the distribution of the CYP2C9*2 alleles (C/T). In the drug-responsive group CYP2C9*2, C allele frequency was 0.97 and T allele frequency was 0.03, whereas in epileptic drug-refractory cases, C allele frequency was 1 and T allele frequency was 0. CYP2C9*3 alleles (A/C) C allele frequency was found to be 0 in both drug-refractory cases and drug-responsive cases, indicating that this particular variant is not associated with the drug-refractory cases. The χ2 analysis for CYP2C9*2 & CYP2C9*3 frequency performed, and the P values greater than 0.05 (P=0.2186 and P=0.9332) indicated that the distribution of genotypes was in compliance with Hardy Weinberg genetic equilibrium.
Regarding the CYP2C19 gene, two variants were considered in the present study: the CYP2C19*2 and CYP2C19*3. A study by Giusti et al., (2007) [44] found an association with carriers (GA genotype/A-allele) of the CYP2C19*2 polymorphism and increased residual platelet reactivity observed in patients with acute coronary syndrome on dual antiplatelet treatment with clopidogrel and aspirin. A study was done by Kaneko et al. (1997) to find out the distribution of the CYP2C19*2 and CYP2C19*3 mutations in malaria endemic islands of Vanuatu [45]. The CYP2C19*2 (A) allele represented 70.6% alleles and the CYP2C19*3 (A) allele represented 13.3% alleles. Studies showed that homozygosity or compound heterozygosity for the mutations was associated with poor metabolism of proguanil, which is recommended for malaria chemoprophylaxis. The data suggested that 70.6% of individuals had the poor metabolizer phenotype, a finding with major implications for the efficacy of proguanil in this population [45].
CYP2C19*2 mutations at nucleotide 681 (G>A) in exon 5 that create an abolished splice site leading to a premature stop codon, resulting in a truncated non-functional protein [46]. The truncated protein had 234 amino acids which lacked the heme-binding region making it catalytically inactive. A study conducted by Wang et al., (2009) [47] in the Chinese population, in which the CYP2C19*2 polymorphisms among healthy participants in mainland Chinese Kazakh, Uygur and Han populations genotype and allele distribution patterns revealed that the allele frequency of CYP2C19*2 (A) significantly lower in Chinese Kazakh (15.4%), Uygur (16.1%) populations compared to the Chinese Han population (28.8%), suggesting disease susceptibility or drug-response associated with enzyme activity of CYP2C19*2 may differ in diverse ethnic populations in China. There was a statistically significant difference in the distribution of CYP219*2 (G/A, rs4244285) polymorphism genotypes and the GA genotype (rs4244285) was associated with almost twice the risk of epilepsy occurrence in the Polish population [40].
CYP2C19*3 point mutation at nucleotide 636 (G>A) in exon 4 results in a premature stop codon, thereby synthesizing a nonfunctional protein. CYP2C19*3 mutation that is predominant in an Asian population [48].
In the present study, CYP2C19*2 (rs4244285) polymorphism minor allele (A) frequency in the drug-responsive group was found to be 0.45 and in the drug-refractory group was 0.44. This minor allelic frequency is in concordance with earlier reports (0.41) from south India [49], north Indian population (0.30%) [50], and Tamilian Population (0.37%). In our study, the G allele frequency in drug-responsive cases was 0.55 and A allele 0.45. G allele frequency in drug-refractory case was 0.56 and A allele 0.44 (Table 6). The genotype distribution of CYP2C19*2 polymorphism was compared in different combinations in epileptic drug-responsive cases and epileptic drug-refractory cases and odd’s risk estimates showed no association (GG vs GA:OR: 1.133; (95% CI: 0.304-4.21, P=0.851 & GG vs AA:OR: 0.700; (95% CI: 0.090-5.432, P=0.733) (Table 6).
The minor allele (A) frequency of CYP2C19*3, rs4986893 polymorphism in drug-responsive group was found to be 0.03, which is similar to that of previously reported studies 0.01% [49] and 0.02. In our study, the G allele frequency in drug-responsive cases was 0.97 and A allele was 0.03. The G allele frequency in drug-refractory cases was 1 and A allele frequency was 0 (Table 7). The genotype distribution of CYP2C19*3 polymorphism was compared in different combinations in epileptic drug-responsive cases and epileptic drug-refractory cases and odds risk estimates showed no significant association (GG vs GA: OR: 0.231 (95% CI: 0.010-5.046), P=0.352; GG vs AA: OR: 1.156 (95% CI: 0.022-60.42), P=0.942 (Table 7). Our study results for these two polymorphisms in CYP2C19*2 & CYP2C19*3 indicated that these variants were not associated with drug-refractory epilepsy cases in Telangana.
The data on negative or no association of the CYP 450 polymorphisms with drug-responsive/drug-refractory epilepsy was meager/not reported prior to our study and may be ascribed to the publication bias in terms of publishing negative/ no association study in scientific communication throughout the world.
Overall, the present study of CYP 450 2C drug-response polymorphisms and their association with drug-responsive and drug-refractory epilepsy did not reveal any significant influence of these polymorphisms on drug-refractory epilepsy in the Telangana population of south Indian origin. The study was performed on a limited sample size of 65 study subjects from tertiary care hospital. However, the study has to be extended to the large sample for the establishment of the significance of the specified polymorphisms in drug-response /drug-refractory epilepsy, therefore, the study outcomes may not be generalized.
CONCLUSION
In the present study, genetic polymorphisms in CYP2C9*2, CYP2C9*3, CYP2C19*2, and CYP2C19*3 did not reveal any significant association with drug-refractory epilepsy. The drug-refractory epilepsy seen in the present study cases might be associated with other than studied genetic variations in the same genes or other genes. The study was performed in a small sample setup and to be extended further to a large sample for understanding the precise role of these polymorphisms in drug-refractory epilepsy.
LIST OF ABBREVIATIONS
| CYPs | = Cytochrome P450 |
| NSAIDs | = Non-Steroidal Anti-Inflammatory Drugs |
| GTCS | = Generalized Tonic-Clonic Seizure |
| PCR | = Polymerase Chain Reaction |
| RFLP | = Restriction Fragment Length Polymorphism |
| AED | = Anti-Epileptic Drug |
ETHICS APPROVAL AND CONSENT TO PARTICIPATE
The study subjects were recruited since the protocol approval by the institutional ethics committee i.e. 10.03.2016.
HUMAN AND ANIMAL RIGHTS
No animals were used in this research. All procedures performed in studies involving human participants were in accordance with the ethical standards of institutional and/or research committees and with the 1975 Declaration of Helsinki, as revised in 2013.
CONSENT FOR PUBLICATION
Informed consent was obtained from all participants.
STANDARDS OF REPORTING
STROBE guidelines were followed.
AVAILABILITY OF DATA AND MATERIALS
The authors confirm that the data supporting the findings of this research are available within the article.
FUNDING
The study was conducted by utilizing the intramural grants of DHR-MRU-Osmania Medical College. The study has not received any funding from any Agency/Award/Grant.
CONFLICT OF INTEREST
The authors declare no conflicts of interest.
ACKNOWLEDGEMENTS
We acknowledge the financial support received from the Department of Health Research (DHR), to conduct the study protocols at the Multi-Disciplinary Research Unit (MRU) of Osmania Medical College, Hyderabad. Our sincere thanks to DHR-MRU-OMC staff, Mr. Bandi Sagar, Lab technician for supporting the lab work. We also thank all the study participants for their cooperation during the study and the post-graduates for data collection from the patients. Special thanks to Dr. R. Yasholatha, Officer on Special Duty, TSWREIS, Hyderabad for reviewing the statistical analyses performed in the study.