All published articles of this journal are available on ScienceDirect.

Cancer Risk in Elderly Korean Patients with Neurodegenerative Disease and its relation to Type 2 Diabetes
Authors Info & Affiliations
Abstract
Introduction:
Some studies suggest that neurodegenerative diseases (NDs), cancer, and type 2 diabetes (T2D) are all related to protein misfolding and may be linked. This study aimed to determine whether these diseases are associated with each other.
Objective:
The aim of the study was to investigate the difference in cancer incidence according to the presence or absence of T2D in the ND group and the control group during the 10-year follow-up period.
Methods:
A population-based 10-year follow-up study was conducted using the Korean National Health Insurance Service Database between 2002 and 2015. The study population included the ND group (n = 9,292) and the control group (n = 46,742), who were aged 60 to 84 years. Cox proportional hazards regression was used to estimate multivariable-adjusted hazard ratios (HRs) for cancer.
Results:
ND and/or T2D were newly diagnosed in both groups during the follow-up period. The newly diagnosed ND cases before cancer onset were 2,412 (26.0%) and 15,435 (33.0%) in the ND and control groups, respectively (p < 0.01). The newly diagnosed T2D cases were 4,691 (50.5%) and 25,695 (55.0%) in the ND and control groups, respectively (p < 0.01). At the end of the observation period, the number of cancer patients was 2,040 (22.0%) and 8,628 (18.5%) in the ND and control groups, respectively (p < 0.01). The ND group was associated with an increased risk of cancer (HR = 1.25). In both groups, newly diagnosed ND and T2D showed an additive effect on cancer incidence during the follow-up period.
Conclusion:
This study showed that cancer incidence was positively associated with ND and T2D. These results show that ND, cancer, and T2D are related. More replication studies are needed to address the association between ND, cancer, and T2D.
1. INTRODUCTION
Neurodegenerative disease (ND) and cancer are often thought of as disease mechanisms at opposite ends of a spectrum: one due to premature cell death and the other due to enhanced resistance to cell death. There is now increasing evidence to link these two disparate processes, and they share common mechanisms of genetic and molecular abnormalities [1-3].
Several NDs are classified as protein misfolding diseases, as they are associated with misfolded protein aggregation. Recent research suggests that aggregated proteins, the long- time hallmarks of ND, also play a role in cancer [4, 5]. In addition to ND and cancer, type 2 diabetes (T2D), a common disease in the elderly, can be classified as a protein misfolding disorder. Recently, evidence suggested that the formation of toxic aggregates of islet amyloid polypeptide (IAPP) could contribute to β-cell dysfunction and disease [6]. The presence of misfolded IAPP aggregates of different sizes, ranging from small soluble oligomers to large fibrillar aggregates, deposited in the Langerhans islets of patients affected by T2D is well established. However, the mechanism of protein aggregation and its associated toxicity is still unclear [7].
A growing body of evidence connects T2D to NDs, such as Alzheimer's disease (AD). Epidemiological studies show that T2D increases the risk of AD [8, 9]. Furthermore, other epidemiological studies have suggested that T2D appears to be associated with cancers, particularly hepatic, pancreatic, colorectal, bladder, endometrial, and breast cancers [10-15].
Several biological mechanisms have been suggested to explain the link between T2D and cancer [16, 17]. In addition to the association between T2D and cancer, previous studies have reported an association between ND and cancer. Many epidemiological studies show that NDs and cancer are inversely related. For example, a lower incidence of AD dementia in people with cancer and a low incidence of cancer in people with AD dementia [18-20]. On the contrary, in the case of research on the relationship between Parkinson’s disease (PD) and cancer, the results of previous epidemio- logical studies are inconsistent. Many epidemiological studies have reported associations between PD and cancers, which support a general inverse association and, more recently, a positive association with certain cancers, such as skin, breast, and brain [21]. Some studies have reported that patients with PD have a lower risk of developing cancer [22], but other studies have reported the opposite [23].
If cancer, T2D, and ND have a common pathophysiology, these diseases may be epidemiologically related. This study aimed to determine whether these diseases are associated with each other in epidemiologic studies. For this purpose, we conducted a retrospective cohort study to investigate the difference in cancer incidence based on the presence or absence of T2D between patients with and without a first diagnosis of ND using the National Health Insurance Service (NHIS) database (DB) for the entire Korean population.
2. MATERIALS AND METHODS
2.1. The NHIS Database
This study used data from the Korean NHIS database. We obtained approval from the Review Committee of the National Health Insurance Corporation for permission to use national health information data (NHIS-2021-1-254). The study was carried out according to the ethical principles outlined in the Declaration of Helsinki. All study procedures and ethical aspects were approved by the Institutional Review Board (IRB) of Keimyung University Dongsan Hospital (IRB number: DSMC 2019-08-067-004).
All Korean citizens were required to enroll in the Korean NHIS. A total of 97% and 3% of the Korean population were covered by the Medical Assistance Program and the Medical Care for Patriots and Veterans Affairs Scheme, respectively. The data collected by the NHIS DB included detailed treatment practices and prescriptions based on the fee-for-service payment model, as well as medical information from all Korean citizens who have signed up for medical insurance. The NHIS claimed for inpatient and outpatient visits, procedures, and prescriptions were coded using the International Classification of Diseases, 10th Revision (ICD- 10), adopted in Korea in 1995, and the Korean Drug and Anatomical Therapeutic Chemical Codes [24]. The NHIS routinely audits claimed, and the data were considered reliable and used in numerous peer-reviewed publications [25, 26].
The data-sharing service of the NHIS DB was largely divided into customized and sample DBs. The customized DB (NHIS-National Health Information Database; NHIS-NHID) was representative of the transmission data provided by de-identifying health insurance and long-term care insurance data collected by the DB. As the data were cohort-based, longitudinal studies were possible, as are studies on low-prevalence diseases, including rare ones, using a customized database. This DB can be used for a population-based cohort study, according to the operational definition of some diseases [27, 28]. We used a customized DB to select the study population suitable for the research purpose.
2.2. Study Population
This study was designed as a population-based, retro- spective, longitudinal cohort study.
We used data corresponding to ages 60 to 84 in 2002 from the Korean NHIS Customized Data (NHIS-2021-1-254) for a period of 14 years, from 2002 to 2015. The data extraction process for this study is presented in Fig. (1). The diagnoses in the NHIS DB are based on the Korean Classification of Diseases, 6th version (KCD-6), which is essentially a revision of ICD-10. To increase diagnostic precision, patients were considered to have ND if they had more than one medical claim with a diagnostic code of AD (KCD-6 codes G300, G301, G308, G309, F000, F001, F002, or F009), PD (KCD-6 codes G20 or F023), or circumscribed brain atrophy (CBA) (KCD-6 codes G310, G3101, G3102, G3103, G3104, G3108, or F020) and had received prescriptions for antidementia drugs (donepezil, rivastigmine, memantine, or galantamine) and/or antiparkinsonian drugs more than once after their first diagnosis between January 2003 and December 2005. Cancer was determined from a diagnosis code of malignant neoplasms (C00–C97), in situ neoplasms (D00-D09), and neoplasms of uncertain or unknown behavior (D37–D48). T2D was defined if KCD-6 codes with E11 were assigned more than twice per patient. Patients with any diagnostic code of ND and cancer before 2003 or those with a diagnostic code of vascular dementia (KCD-6 codes F010, F011, F012, F013, F018, and F019) were excluded.
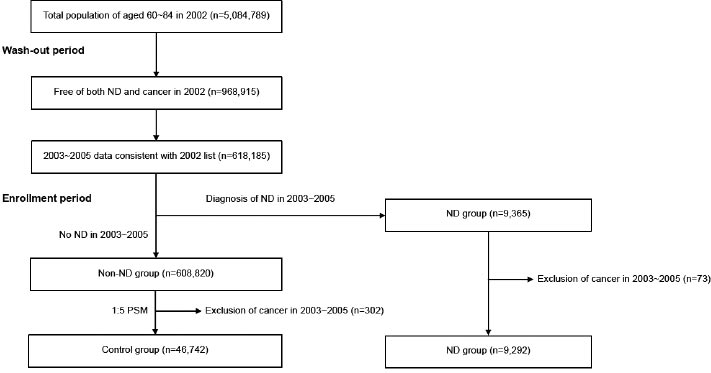
The ND group (n = 9,292) consisted of 3,141 AD patients, 5,812 PD patients, and 339 CBA patients. Patients with CBA include those with frontotemporal dementia, Pick’s disease, and progressive isolated aphasia. Among the patients in the non-ND group, those with characteristics similar to those of the ND group were extracted, including gender, age, and comorbidities. We used the 1:5 propensity score matching (PSM) method to match patients from the non-ND group with patients from the ND group. 46,742 pairs (7.6% of the patients in the non-ND group) were matched for the control group. Therefore, the total number of study subjects were 56,034 (9,292 in the ND group and 46,742 in the control group).
Propensity scores were calculated based on the gender, age, and comorbidities of the subjects assessed using the total score of Charlson's Comorbidity Index (CCI). Although a matching method using the propensity score was performed before the start of the study, there was a significant difference in the frequency of T2D at the time of study enrollment (baseline) between the ND and control groups (2,572/9,292 vs. 9,364/46,742; χ2 = 270.33; p < 0.01).
We included T2D as a confounding variable in the calculation of the hazard ratio (HR) for cancer using Cox proportional hazards regression because previous studies have shown that T2D can affect cancer incidence.
2.3. Definition of Outcome
The primary outcome of this study was the incidence of cancer. Data were analyzed from the index date (January 1, 2006) to the first instance of cancer diagnosis, to the date of last contact (censored data), or to the end of the study period (December 31, 2015).
2.4. Data Management and Statistical Analysis
Stata/MP 16 (Stata Corp LLC, College Station, TX, USA) was used for data management and statistical analysis [29]. A Student's t-test was used to compare means between the ND and control groups for continuous variables. The chi-square test was performed to determine the difference in cancer frequency between the ND and control groups. The Kaplan-Meier method was employed for estimating and plotting cancer-free curves and the log-rank test was used to examine the difference in cancer-free probability between the ND and control groups. Cox proportional hazards regression was used to estimate multivariable-adjusted HRs and 95% confidence intervals (CI) for cancer and to adjust for potential confounders including gender, age, CCI-total score, and T2D. The proportional hazards (PH) assumption underlying both the log-rank test and the Cox regression model was examined graphically, and the results showed no violations. All statistical tests were two-sided, and a p-value of 0.05 or lower was considered statistically significant.
3. RESULTS
3.1. Sample Characteristics
Before PSM, there were statistically significant differences in sex, age, and total CCI scores between the ND and control groups, but after PSM, the difference between the two groups was no longer present except for age, and the matching was relatively good (Table 1).
3.2. Frequency of newly diagnosed ND and T2D
Subjects in both the ND and control groups continued to develop new or other NDs before cancer onset during a 10-year follow-up period from 2006 to 2015. Therefore, we investigated cases of newly diagnosed ND before the onset of cancer between 2006 and 2015 in both groups. In this case, the diagnostic criterion for various NDs was established as cases with a diagnostic code for the disease in the main diagnosis or auxiliary diagnosis (from first to third). The administration of antidementia and/or antiparkinsonian drugs was not considered a diagnostic criterion. The frequency of newly diagnosed ND before the onset of cancer during the follow-up period was 2,412/9,292 (26.0%) in the ND group and 10 15,435/46,742 (33.0%) in the control group (χ2 = 178.19, p < 0.01).
In both the ND and control groups, patients who did not have T2D at the time of study enrollment also developed new T2D during the follow-up period. The frequency of newly diagnosed T2D before the onset of cancer during the follow-up period was 4,691/9,292 14 (50.5%) in the ND group and 25,695/46,742 (55.0%) in the control group (χ2 = 62.89, p < 15 0.01).
3.3. Incidence of Cancer
At the end of the observation (December 31, 2015), the number of cancer patients was 2,040 (22.0%) in the ND group and 8,628 (18.5%) in the control group (χ2 = 61.45, p < 0.01). The frequency of cancer was 579/2,572 (22.5%) in the ND group with baseline T2D and 1,461/6,720 (21.7%) in the ND group without baseline T2D (χ2 = 0.64, p = 0.42). The frequency of cancer was 1,852/9,364 (19.8%) in the control group with baseline T2D and 6,776/37,378 (18.1%) in the control group without baseline T2D (χ2 = 13.54, p < 0.01).
There was no significant difference in cancer frequency between the two groups according to the presence or absence of baseline T2D in the ND group, but there was a significant difference in the control group.
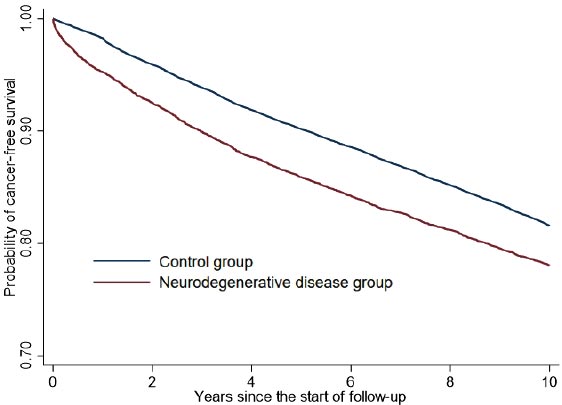
The incidence of cancer in the ND group was significantly higher than that in the control group. The cancer incidence rate was 25.3 per 1,000 person-years (95% CI, 24.3–26.5) in the ND group and 20.4 per 1,000 person-years (95% CI, 20.0–20.9) in the control group. The restricted mean survival time (mean time to the cancer diagnosis) was 8.66 years (95% CI, 8.61– 8.72) in the ND group and 9.04 years (95% CI, 9.02–9.06) in the control group. The log-rank test showed a significantly different pattern of cumulative cancer-free survival probabilities between the ND and control groups (χ2 = 60.48, p < 0.01). Fig. (2) shows the Kaplan–Meier survival curves of the ND and control groups. After adjustment for gender, age, and comorbidities (CCI-total score), the adjusted HR for cancer in patients in the ND group compared to the control group was 1.25 (95% CI, 1.19–1.31; P < 0.01).
Since newly diagnosed ND or T2D during the follow-up period can affect cancer incidence, we investigated the incidence of cancer according to the presence or absence of newly diagnosed ND or T2D during the follow-up period in the ND and control groups (Tables 2 and 3). As a result, newly diagnosed ND during the follow-up period had no effect on cancer incidence in the control group, but had a significantly increasing effect on cancer incidence in the ND group. On the other hand, newly diagnosed T2D during the follow-up period had a significantly increasing effect on cancer incidence in both the ND and control groups.
| Variables | Before PSM | After PSM | ||||
|---|---|---|---|---|---|---|
| Control Group | ND Group | p-value | Control Group | ND Group | p-value | |
| Gender | - | - | - | - | - | - |
| Male (%) | 281,093 (45.5) | 2,209 (23.8) | <0.01 | 11,178 (23.9) | 2,209 (23.8) | 0.77 |
| Female (%) | 337,019 (54.5) | 7,083 (76.2) | - | 35,564 (76.1) | 7,083 (76.2) | - |
| Age | 70.21±4.91 | 71.02±4.89 | <0.01 | 71.86±4.62 | 71.02±4.89 | <0.01 |
| CCI total | 0.25±0.56 | 0.47±0.75 | <0.01 | 0.48±0.76 | 0.47±0.75 | 0.07 |
| Group | Cancer (%) | No Cancer (%) | χ2 | p |
|---|---|---|---|---|
| Control Group | - | - | - | - |
| Newly diagnosed ND (%) | 2,891 (18.7) | 12,544 (81.3) | 1.13 | 0.29 |
| No Newly diagnosed ND (%) | 5,737 (18.3) | 25,570 (81.7) | - | - |
| ND Group | - | - | - | - |
| Newly diagnosed ND (%) | 568 (23.5) | 1,844 (76.5) | 4.83 | 0.03 |
| No Newly diagnosed ND (%) | 1,472 (21.4) | 5,408 (78.6) | - | - |
Table 3.
| Group | Cancer (%) | No Cancer (%) | χ2 | p |
|---|---|---|---|---|
| Control Group | - | - | - | - |
| Newly diagnosed T2D (%) | 5,279 (20.5) | 20,416 (79.5) | 164.99 | <0.01 |
| No newly diagnosed T2D (%) | 3,349 (15.9) | 17,698 (84.1) | - | - |
| ND Group | - | - | - | - |
| Newly diagnosed T2D (%) | 1,180 (25.2) | 3,511 (74.8) | 56.62 | <0.01 |
| No newly diagnosed T2D (%) | 860 (18.7) | 3,741 (81.3) | - | - |
| Group | Person-years | No. of Cancer (%) | IR | 95% CI |
|---|---|---|---|---|
| Group 1 | 136,304.87 | 2,324 (15.7%) | 17.05 | 16.37 ~ 17.76 |
| Group 2 | 56,625.51 | 1,025 (16.5%) | 18.10 | 17.03 ~ 19.24 |
| Group 3 | 147,433.41 | 3,413 (20.7%) | 23.15 | 22.39 ~ 23.94 |
| Group 4 | 82,164.74 | 1,866 (20.3%) | 22.71 | 21.70 ~ 23.76 |
| Group 5 | 31,109.90 | 631 (18.0%) | 20.28 | 18.76 ~ 21.93 |
| Group 6 | 9,585.62 | 229 (20.8%) | 23.89 | 20.99 ~ 27.19 |
| Group 7 | 28,853.03 | 841 (24.9%) | 29.15 | 27.24 ~ 31.19 |
| Group 8 | 10,962.94 | 339 (25.9%) | 30.92 | 27.80 ~ 34.40 |
To investigate the independent and combined effects of newly diagnosed ND and T2D on cancer incidence in both the ND and control groups, we classified the total subjects (n = 56,034) into eight groups based on the presence or absence of newly diagnosed ND and T2D.
Group 1 is the control group without both newly diagnosed ND and T2D (n = 14,825; 26.5%). Group 2 is a control group with only newly diagnosed ND (no T2D) (n = 6,222; 11.1%). Group 3 is a control group with only newly diagnosed T2D (no ND) (n = 16,482; 29.4%). Group 4 is a control group with both newly diagnosed ND and T2D (n = 9,213; 16.4%). Group 5 is an ND group without both newly diagnosed ND and T2D (n = 3,499; 6.2%). Group 6 is an ND group with only newly diagnosed ND (no T2D) (n = 1,102; 2.0%). Group 7 is an ND group with only newly diagnosed T2D (no ND) (n = 3,381; 6.0%). Group 8 is an ND group with both newly diagnosed ND and T2D (n = 1,310; 2.3%).
Table 4 shows the frequencies and incidence rates of cancer during the follow-up period in eight groups, based on the presence or absence of newly diagnosed ND and/or T2D. The frequencies and incidence rates of cancer gradually increased in the following order, except in groups 3 and 4: cases without newly diagnosed ND and T2D; cases with only newly diagnosed ND; cases with only newly diagnosed T2D; and cases with newly diagnosed ND and T2D.
4. DISCUSSION
This nationwide population-based cohort study demonstrated an 18.8% increase in total cancer risk among ND patients compared to control patients without ND over a 10-year follow-up period. The HR for cancer in the ND group, compared to the control group, was 1.25. For both the ND and control groups, individuals with T2D at the time of study enrollment had a slightly higher risk of cancer compared to those without T2D. Compared to the pure control group, where no T2D or other ND occurred during the follow-up period, the HR for cancer in the ND group diagnosed with T2D and other ND during the follow-up period increased to 1.87. These results suggest that the risk of cancer increases further when new cases of ND and T2D are diagnosed during the follow-up period. These findings are contrary to the results of previous epidemiological studies that examined the association between ND and cancer. The difference between the results of this study and those of previous studies is likely due to methodological differences. In many previous studies on the association between a particular ND (AD or PD) and cancer, the control group for ND was simply selected as subjects who did not have AD or PD. In such cases, ND other than AD or
PD can be included in the control group, which can affect cancer development in the control group. To confirm the selection bias in the control group selection process, we separately analyzed only data from AD patients and compared cancer incidence rates with two types of control groups for AD (non-ND control group and non-AD control group). The number of cancer patients in AD patients was 632 out of 3,141 (20.1%). When the control group was selected as patients without ND (non-ND control group), 8,628 (18.5%) out of 46,742 patients in the non-ND control group were diagnosed with cancer (χ2 = 5.38, p = 0.02, compared to AD patients). However, when the control group was selected as patients without only AD (non-AD control group; in this case, ND other than AD can be included in the control group), 10,036 (19.0%) out of 52,893 patients in the non-AD control group were diagnosed with cancer (χ2 = 2.53, p = 0.11, compared to AD patients). Therefore, this finding showed that cancer incidence increased slightly when NDs, other than AD, were included in the control group. These results suggest that previous epidemiological studies, which reported a lower cancer incidence in the AD group compared to the control group, may not have fully accounted for changes in cancer incidence caused by ND other than AD in the control group.
In this study, patients without ND were selected as the control group, and as a result, the incidence of cancer was higher in the ND group during a 10-year follow-up period compared to the control group.
The results of the positive association between ND and cancer in this study are consistent with the fact that, unlike previously thought only in terms of apoptosis, recent molecular biology studies have suggested that the pathophysiology of cancer and ND has a common mechanism. Signaling pathways, such as those arising from DNA damage, deviation from the normal cell cycle, inflammation, and oxidative stress that affect cell death and survival, have been studied in connection with cancer development. However, recent studies have also linked them to ND [1-3]. p53, cyclin D, cyclin E, cyclin F, Pin1, and protein phosphatase 2A are all involved in the pathophysiology of cancer and ND and play a role in cell cycle regulation [30, 31]. Among these, p53 is the most widely studied tumor suppressor gene and is known to be associated with 50% of cancers [32]. It is well known that p53 plays an important role in apoptosis. In most cancers, mutations at the gene level prevent it from functioning properly, resulting in poor activity of p53. This allows cancer cells to escape apoptosis, leading to cancer. However, not only changes at the gene level, but the protein folding process is also an important factor in preventing p53 from functioning [33-35]. Cancer occurs not only due to a mutation in the p53 protein but also due to a problem in the p53 folding process [36]. In addition to the association between ND and cancer, many studies have reported that T2D is also associated with ND and cancer. In the relationship between T2D and ND, amylin functions (or IAPP) in the periphery, and their impact on pancreatic cell function and T2D progression have been described [6, 37]. The presence of AD-related proteins (β-amyloid protein and tau protein) in the pancreas and insulin-sensitive tissues, and their role in inducing peripheral insulin resistance or disturbances in insulin secretion,is a potential mechanistic link among these AD-related proteins that promote T2D. Similarly, the accumulation of amylin in the brain, as well as its ability to induce neurotoxicity and form “cross-seeding” aggregates with β-amyloid protein demonstrates amylin's role in neurodegeneration [38, 39]. The association between diabetes and cancer is well-established [40, 41]. Epidemiological studies suggest that people with diabetes (predominantly T2D) are at a significantly higher risk of many forms of cancer [42, 43]. However, the risk of prostate cancer is lower in men with T2D [44]. The relationship between T2D and cancer varies depending on the cancer site, and more rigorous and collaborative studies are needed to understand the relationship between the two diseases.
Our study has some limitations. First, this study was a retrospective observational design based on claim data, and the diagnosis of NDs was identified using KCD-6 codes in the claim database, which may have been inaccurate compared to diagnoses obtained from a medical chart, neuroimaging tests, or neuropsychological tests. However, the main purpose of this study is not to evaluate the exact prevalence or incidence of ND or cancer but rather to determine whether there is a difference in cancer incidence between the ND group and the control group. Therefore, if the same diagnostic process was applied to both groups, the authors consider that there would be no problem comparing the difference in incidence between both groups in this study. Second, this study did not analyze the association between ND and various types of cancer. Cancer is a heterogeneous disease that can be caused by a variety of pathophysiological mechanisms, and this study had the problem that various types of cancers were considered and analyzed as a single group. Third, this study did not control for several factors that could affect cancer development. Lastly, patients with ND tend to have less frequent contact with the healthcare system, which may have caused surveillance bias. We investigated the utilization rate of medical institutions in patients of the ND and control groups to examine the possibility of this surveillance bias. The annual average number of visits to medical institutions before the onset of cancer was investigated. There was no significant difference in the average annual number of visits to medical institutions between the two groups, with an average of 26.8 ± 19.8 in all patients in the ND group and an average of 26.6 ± 18.7 in all patients in the control group (t = −0.75, p = 0.45).
CONCLUSION
This study showed that cancer incidence was positively associated with both ND and T2D. These results show that NDs, cancer, and T2D are related to each other and suggest that they may share a common pathophysiological process. More replication studies are needed to address the association among ND, cancer, and T2D.
AUTHORS' CONTRIBUTIONS
H.C. Kim conceived and designed the study, H.C. Kim and J.H. Kim analyzed the data, all authors participated in the interpretation of the data, H.C. Kim, J.H. Kim, and B.C. Jang wrote and reviewed the manuscript, H.J. Lee and Y.T. Kim reviewed the manuscript, and all authors have read and agreed to the published version of the manuscript.
LIST OF ABBREVIATIONS
| ND | = Neurodegenerative Disease |
| NHIS | = National Health Insurance Service |
ETHICS APPROVAL AND CONSENT TO PARTICIPATE
The study was approved by the Institutional Review Board (IRB) of the Keimyung University Dongsan Hospital (IRB number: DSMC 2019-08-067-004).
HUMAN AND ANIMAL RIGHTS
No animals were used in this research. All procedures performed in studies involving human participants were in accordance with the ethical standards of institutional and/or research committees and with the 1975 Declaration of Helsinki, as revised in 2013.
CONSENT FOR PUBLICATION
Informed consent was obtained from all participants of this study.
AVAILABILITY OF DATA AND MATERIALS
Not applicable.
STANDARDS OF REPORTING
STROBE guidelines were used.
FUNDING
This study was funded by a research promotion grant from the Keimyung University Dongsan Medical Center in 2020.
CONFLICT OF INTEREST
The authors declare no conflict of interest financial or otherwise.
ACKNOWLEDGEMENTS
Declared none.